Flow Chart Maker
Design process flows, decision trees, and workflow diagrams with our free chart maker online. Drag and drop shapes, connect them with arrows, and export your flow chart instantly.
100% Free Chart Maker Online
ChartMakerBox is a free chart maker online that helps you create professional flow charts, bar charts, pie charts, and diagrams in your browser. No account required — just pick a tool and start building.
Trusted by students, teachers, marketers, and teams worldwide.
Select a chart type below and jump straight into the free chart maker online editor. Every tool runs in your browser — your data stays private.
Create professional flow charts with drag-and-drop shapes and connectors. Export as PNG or SVG.
Paste spreadsheet data, clean and sort categories, customize bar chart styles, and export PNG, SVG, CSV, or JSON.
Enter category names and values, create pie or donut charts with percentages, legends, ranking, largest-slice highlight, and export PNG, SVG, or CSV.
Create line charts for trend, time series, progress, and simple line graph needs. This one Line Chart Maker also covers Trend Chart Maker, Time Series Chart Maker, Progress Line Graph Maker, and Simple Line Graph Maker intent.
Create a browser-local Gantt chart from tasks, start dates, end dates, owners, progress, and dependencies. This Gantt Chart Maker combines Project Schedule Maker, Task Timeline Chart, Study Plan Gantt Chart, Content Calendar Gantt Chart, and Simple Project Plan Maker intent with PNG, SVG, and CSV export.
Create organizational charts, org charts, company structure charts, team hierarchy charts, and department charts from manually entered people, roles, departments, managers, notes, and vacancies.
Create horizontal or vertical timelines for project timelines, roadmap timelines, milestone timelines, history timelines, and event timelines. Enter events, dates, phases, and descriptions locally in your browser, then export PNG, SVG, JSON, or a print-ready timeline.
Build mind maps, org charts, fishbone diagrams, timelines, trees, bracket maps, tree tables, and matrices in one local editor. 20 structures with smooth morphing, node icons, color themes, relationship lines, summaries, and outline boxes. Branch with Tab/Enter, then export PNG, SVG, or re-importable JSON.
Create SWOT, Eisenhower, Impact Effort, Risk Reward, Value Cost, and custom 2x2 matrix diagrams in one browser-local Matrix Diagram Maker. Choose a template or customize axes, enter items with X/Y scores, then export PNG, SVG, or Markdown.
Create 2 circle and 3 circle Venn diagrams for compare and contrast work, product comparison, concept comparison, classroom assignments, writing, pros and cons, and competitor analysis. Enter topics, shared points, and differences locally in your browser, then export PNG, SVG, or a print-ready Venn diagram.
Create fishbone diagrams, cause and effect diagrams, Ishikawa diagrams, root cause analysis diagrams, and problem cause diagrams from a manually entered problem, cause categories, key causes, notes, and improvement actions.
Create relationship charts for families, characters, roles, teams, concepts, simple networks, and project dependencies. Enter nodes and labeled relationships locally in your browser, then export PNG, SVG, or JSON.
Create website structure diagrams, SEO site architecture diagrams, content cluster maps, internal linking maps, and page hierarchy diagrams from manually entered pages, URLs, indentation, and links. Runs locally in your browser and exports PNG, SVG, or Markdown.
Create sales funnels, signup funnels, marketing funnels, recruitment funnels, ecommerce checkout paths, and content conversion paths from manually entered stages, quantities, or ratios. Runs locally in your browser and exports PNG, SVG, or CSV.
ChartMakerBox gives you everything you need to turn raw data and ideas into clear visual charts — completely free, completely online.
No installation, no sign-up, no paywall. Open any chart maker tool, enter your data or drag your shapes, and your chart appears in real time. The free chart maker online experience should be frictionless — and it is.
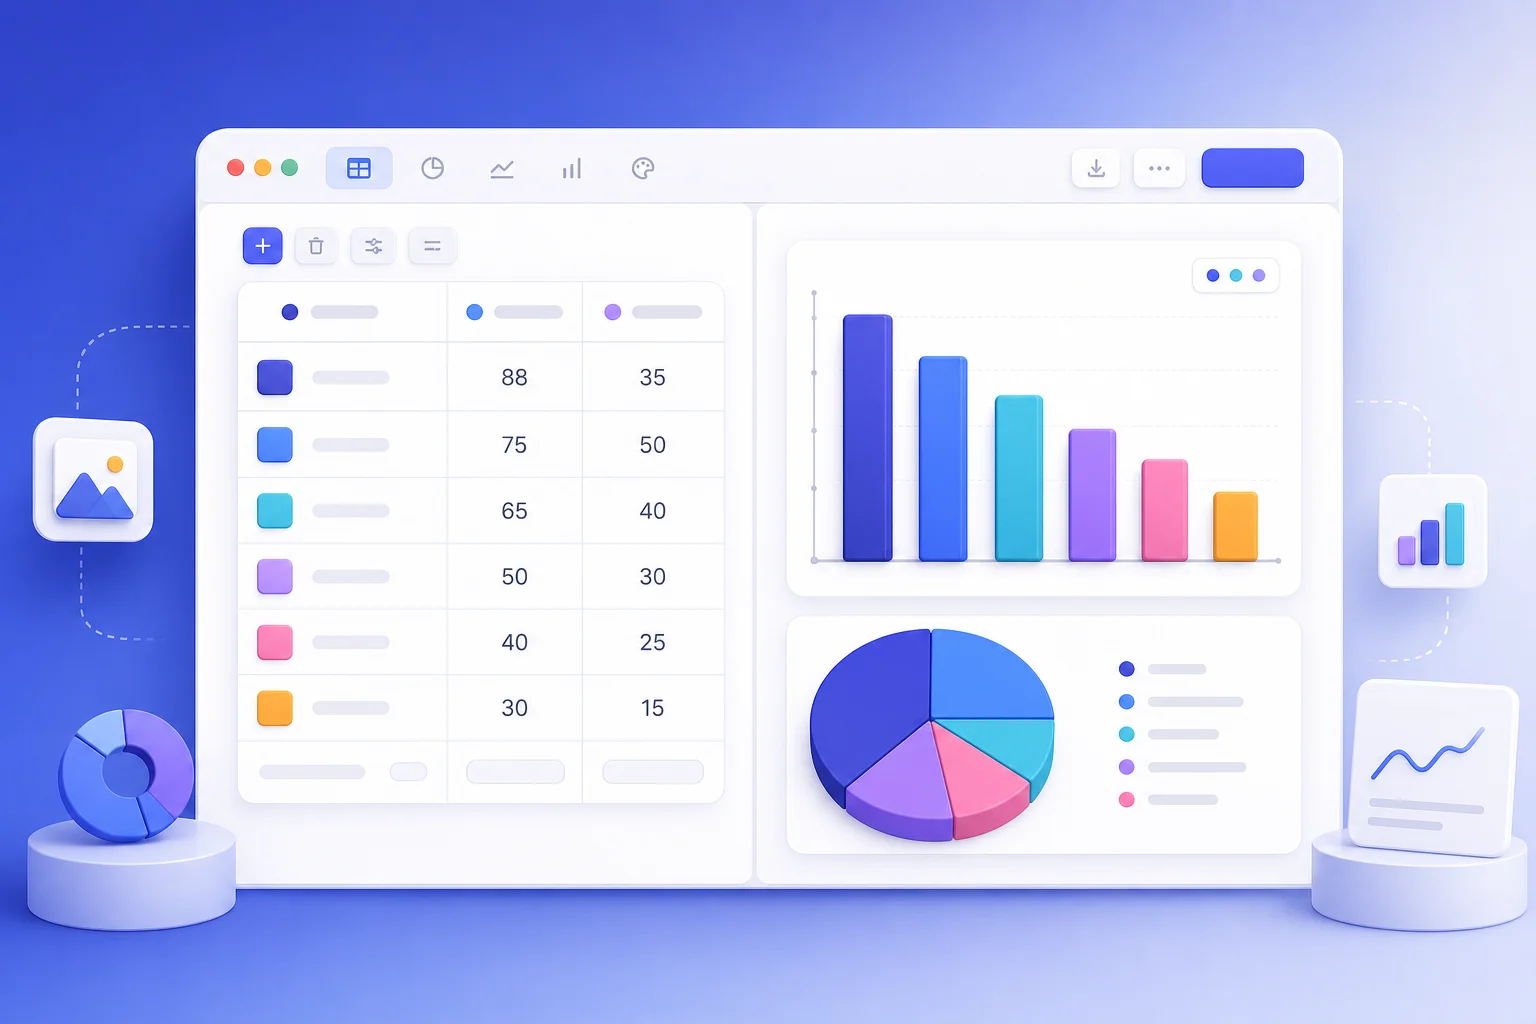
Once your chart looks great, download it as a high-quality PNG image or scalable SVG file. Use your free chart maker online exports in presentations, reports, social media posts, or anywhere else.
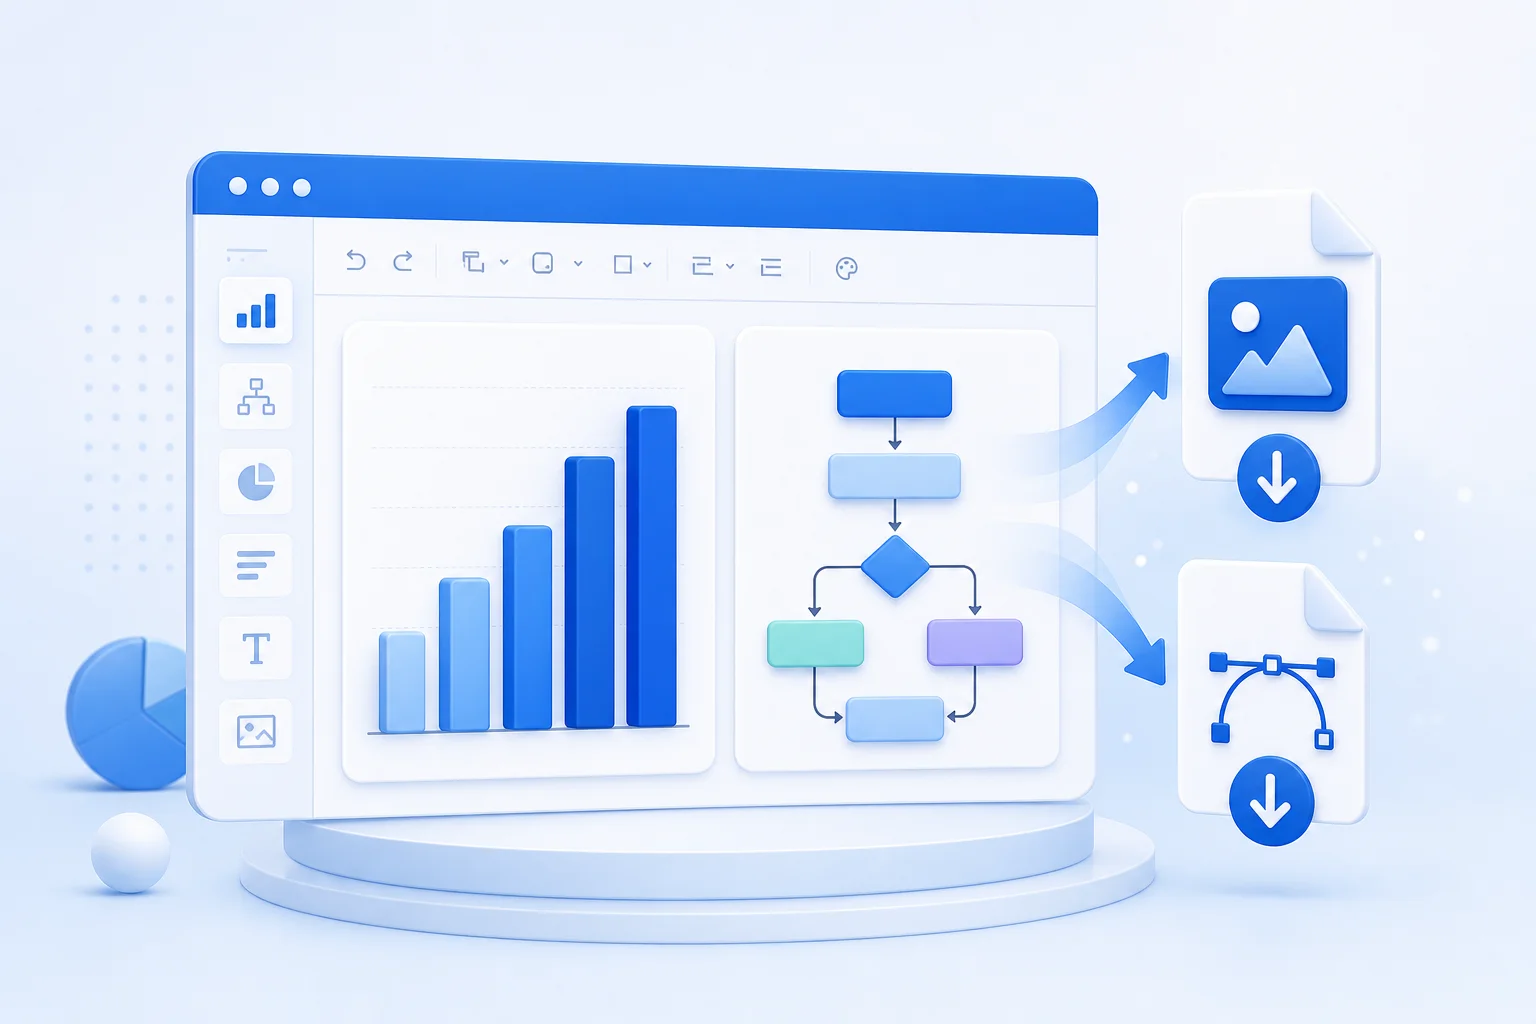
Every chart tool runs entirely in your browser. Your data never leaves your device, and we never store or transmit the information you enter. Use the free chart maker online with complete confidence.

From simple bar charts to complex flow charts, our free chart maker online covers every common visualization need.
Design process flows, decision trees, and workflow diagrams with our free chart maker online. Drag and drop shapes, connect them with arrows, and export your flow chart instantly.
Compare categories side by side with vertical or horizontal bar charts. Enter your data and the free chart maker online renders a clean, labeled bar chart ready to download.
Show proportions and percentages at a glance. Our free chart maker online builds beautiful pie charts and donut charts from your numbers automatically.
Plot trends over time with smooth or stepped line charts. The free chart maker online supports multiple data series, custom colors, and axis labels.
Map out your team structure or organizational hierarchy. Add roles, names, and departments — then export your org chart from the free chart maker online.
Brainstorm ideas visually with branching mind maps. The free chart maker online lets you expand, collapse, and rearrange nodes freely.
Creating professional charts is simple. Follow these three steps to go from data to a polished chart in minutes.
Browse our collection of chart tools — flow charts, bar charts, pie charts, line charts, org charts, and mind maps. Click on the one that fits your data or project.
For data charts, paste or type your numbers into the editor. For diagram-style charts like flow charts, drag shapes onto the canvas and connect them with arrows. The free chart maker online updates your preview in real time.
When your chart is ready, click the export button to download it as a PNG image or SVG vector file. Use the chart in reports, slides, blog posts, or social media — all created with our free chart maker online.
SVG exports are ideal for printing and scaling to any size without losing quality.
Everything you need to know about using our free chart maker online tools.
Yes, 100% free. Every chart tool on ChartMakerBox is free to use with no hidden fees, no watermarks, and no sign-up required. We believe a free chart maker online should actually be free.
No. You can start creating charts immediately without registering. Simply pick a chart type, enter your data or build your diagram, and export the result.
Currently you can create flow charts, with bar charts, pie charts, line charts, org charts, and mind maps coming soon. We are continuously adding new chart types to the free chart maker online.
You can export your charts as PNG images for quick sharing or SVG vector files for scalable, print-quality graphics. Both formats are available at no cost.
Absolutely. All chart tools run entirely in your browser. Your data is never uploaded to our servers. We do not collect, store, or share any data you enter into the free chart maker online.
Yes. Charts you create are yours to use however you like — in business presentations, reports, marketing materials, academic papers, or anywhere else. No attribution is required.
Pick a chart type, enter your data, and export a polished chart in minutes.
Our free chart maker online is ready when you are — no sign-up, no cost, no limits.
100% free. No account required. Your data stays in your browser.