Brainstorming & Idea Maps
Fan out raw ideas from a central topic, group them into branches with color themes and icons, and mark priorities and next steps.
Free Mind Map Maker
Start from a central topic, press Tab to add subtopics and Enter to add siblings, then switch instantly among 20 structures — mind map, org chart, fishbone, timeline, tree, bracket, tree table, and matrix — with animated layout morphing. Add icons, color themes, relationship lines, summaries, and outline boxes. Nothing is uploaded.
One editor for brainstorming, study notes, writing outlines, org charts, fishbone analysis, timelines, project structures, and matrices.
Type from the central topic, press Tab / Enter to branch, then switch among 20 layouts: mind map, org chart, fishbone, timeline, tree, bracket, tree table, and matrix. Add node icons, color themes, relationship lines, summaries, and outline boxes — then export PNG, SVG, or re-importable JSON. Everything runs locally and autosaves in your browser.
It is a single local editor that covers the shared intent behind mind map, org chart, fishbone, timeline, tree, bracket, tree table, and matrix makers: expand one central topic into a clear structure and reshape it instantly.
Write a central topic, press Tab to add subtopics, Enter to add siblings, and Delete to remove. Double-click any node to edit, or drag a node onto another to re-parent it. Editing is keyboard-first, visible, and browser-local — no account or backend.
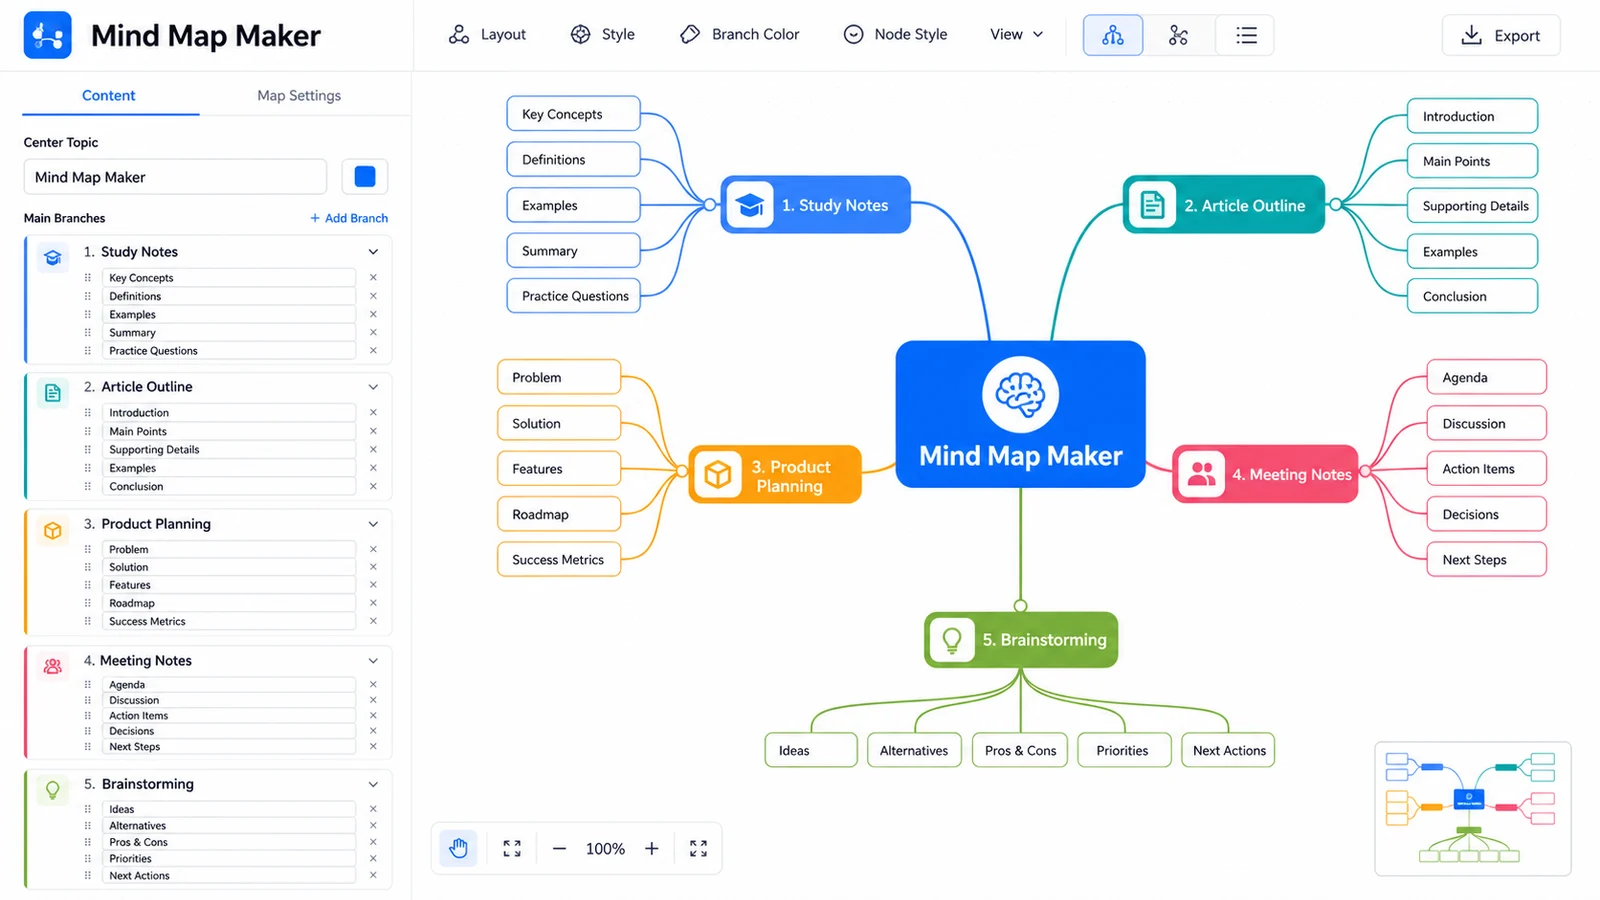
Switch among 20 structures — mind map (right/left/both), org chart, fishbone, timeline (horizontal/vertical/S-curve), tree, bracket, tree table, and matrix. Nodes and connectors animate between layouts so you can compare shapes for the same data. Add node icons, multiple color themes, relationship lines, summaries, and outline boxes.
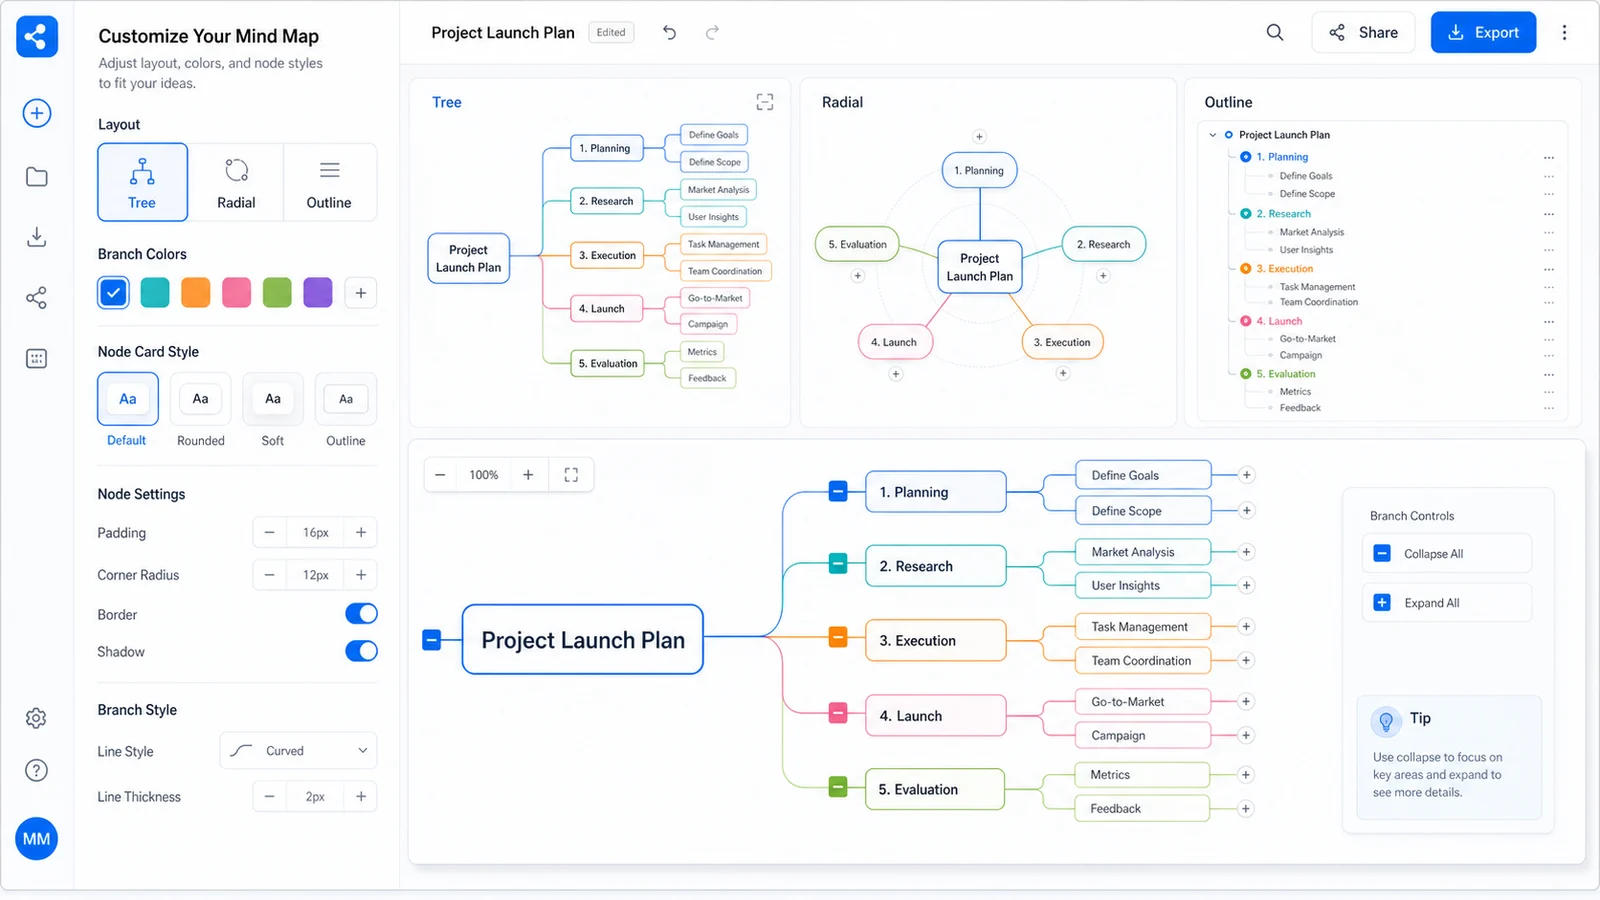
Download a high-resolution PNG for slides, an SVG vector for documents, or JSON you can import again to keep editing. Your draft also autosaves to local browser storage. The flow stays local — no cloud upload, note-app integration, or AI generation.
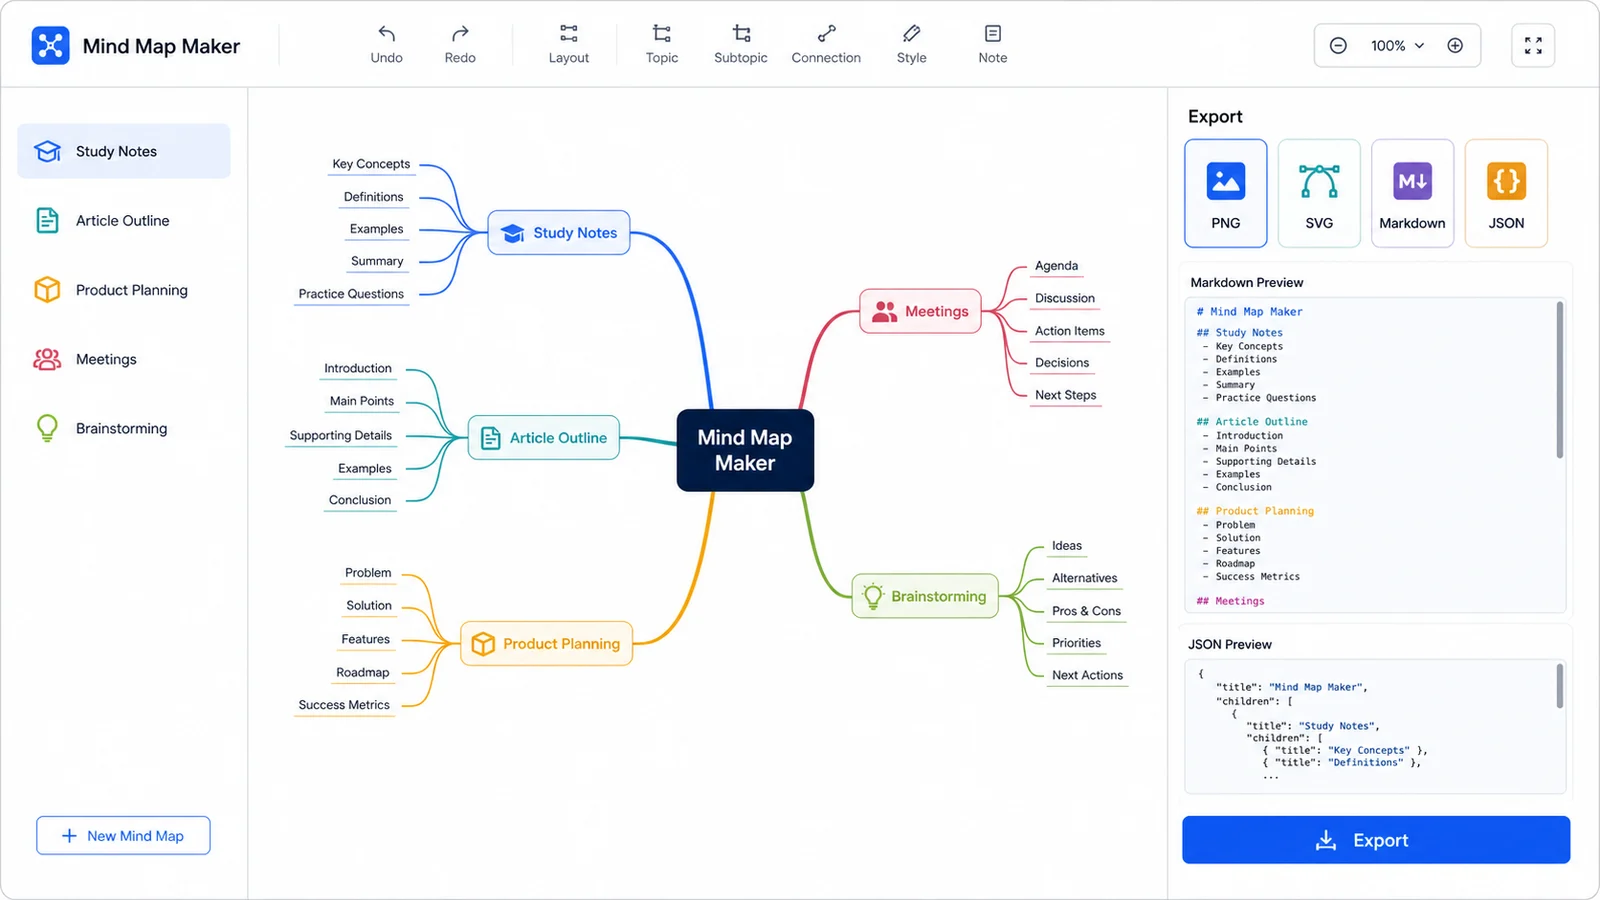
One canvas, many diagram types. Because every structure shares the same node tree, you can start as a mind map and reshape into an org chart, fishbone, timeline, tree table, or matrix without re-entering anything.
Fan out raw ideas from a central topic, group them into branches with color themes and icons, and mark priorities and next steps.
Use the standard or list org layout for reporting lines, team structure, and role hierarchies with elbow connectors.
Analyze root causes with a head-left or head-right fishbone, branching ribs alternating above and below the spine.
Lay milestones out horizontally, vertically, or in an S-curve with axis dots and connector ticks for plans and roadmaps.
Render the same tree as a nested table by row or column, or as a row/column matrix for comparison grids.
Use bracket layouts and outline boxes to organize exam scope, definitions, examples, and review plans, then export to share.
The editor is keyboard-first and browser-local, so you can structure ideas without account setup, backend storage, AI generation, or third-party APIs.
Double-click the central node to rename it to your idea, lesson, project, process, or plan. A focused central topic keeps every branch connected to one purpose.
Press Tab to add a subtopic under the selection and Enter to add a sibling. Drag a node onto another to re-parent it, and click the +/− badge to collapse or expand a branch.
Open the Structure panel to switch among 20 layouts; the diagram morphs between them. Use the Style panel for canvas background and multiple themes, and the Icons panel to tag nodes with priority, progress, emoji, and more.
Download PNG for slides, SVG for scalable graphics, or JSON to re-import later. Exports are static and local, so they never require login, cloud sync, or an AI account.
JSON keeps the exact topics, branches, icons, colors, collapsed states, relationships, summaries, outline boxes, and the chosen structure.
Common questions about layouts, privacy, exports, and what this tool deliberately does not include.
Twenty, grouped into mind map (right, left, both sides), org chart (standard, list), fishbone (head right, head left), timeline (horizontal, vertical, S-curve), tree (down, up, right, left), bracket (right, left), tree table (rows, columns), and matrix (row, column). The same node tree morphs between all of them.
No. It is a manual, front-end editor. It does not call an AI model or generate maps for you — you type the topics, branch them, and choose a structure yourself.
Everything runs in your browser. The editor autosaves to local browser storage and exports files on demand, but it never uploads your topics or notes to a backend service.
A high-resolution PNG for slides and images, an SVG vector that stays sharp at any size, and JSON that you can import again to keep editing the exact same diagram.
Yes. Tag nodes with priority, progress, emoji, arrows, flags, stars, time, month, and weekday icons; apply multiple color themes or per-node colors; and draw relationship lines, summaries, and outline boxes across nodes.
Yes, the editor is responsive, but a larger screen with a keyboard is more comfortable for Tab/Enter branching, dragging nodes, and exporting dense diagrams.
No. Those require backend services, accounts, and collaboration infrastructure. This page stays focused on a private, browser-local diagram workflow.
Open the editor, type a central topic, branch with Tab and Enter, and reshape it across 20 layouts in one click.
Use it for brainstorming, study notes, org charts, fishbone analysis, timelines, project structures, and matrices — no login or cloud setup.
Your draft autosaves locally in your browser unless you export it.