Budget Pie Chart Maker
Show rent, food, transport, savings, subscriptions, and other expenses as clear shares of a monthly or project budget.
Free Pie Chart Maker
Your pie chart is generated locally in your browser. No account connection, database, or online data lookup is required. This Pie Chart Maker also works as a Donut Chart Maker, Percentage Chart Maker, Budget Pie Chart Maker, and Survey Pie Chart Maker for budgets, time allocation, votes, market share, tasks, spending, content categories, and questionnaire results.
Built for reports, slides, school projects, budget breakdowns, survey summaries, and quick percentage charts.
Use the Pie Chart Maker to manually enter category names and values or proportions, switch between pie chart and donut chart modes, review category names, values, percentages, legend, share ranking, largest-share highlight, total statistics, and a data table summary, then export PNG, SVG, CSV, or editable JSON.
This Pie Chart Maker focuses on one search intent: show how categories contribute to a whole with a pie chart, donut chart, percentage chart, budget pie chart, or survey pie chart.
Type category names and values, paste CSV, TSV, or spreadsheet rows, or enter proportions that already add to 100. The Pie Chart Maker detects headers, combines duplicate categories, and turns valid positive values into percentages.
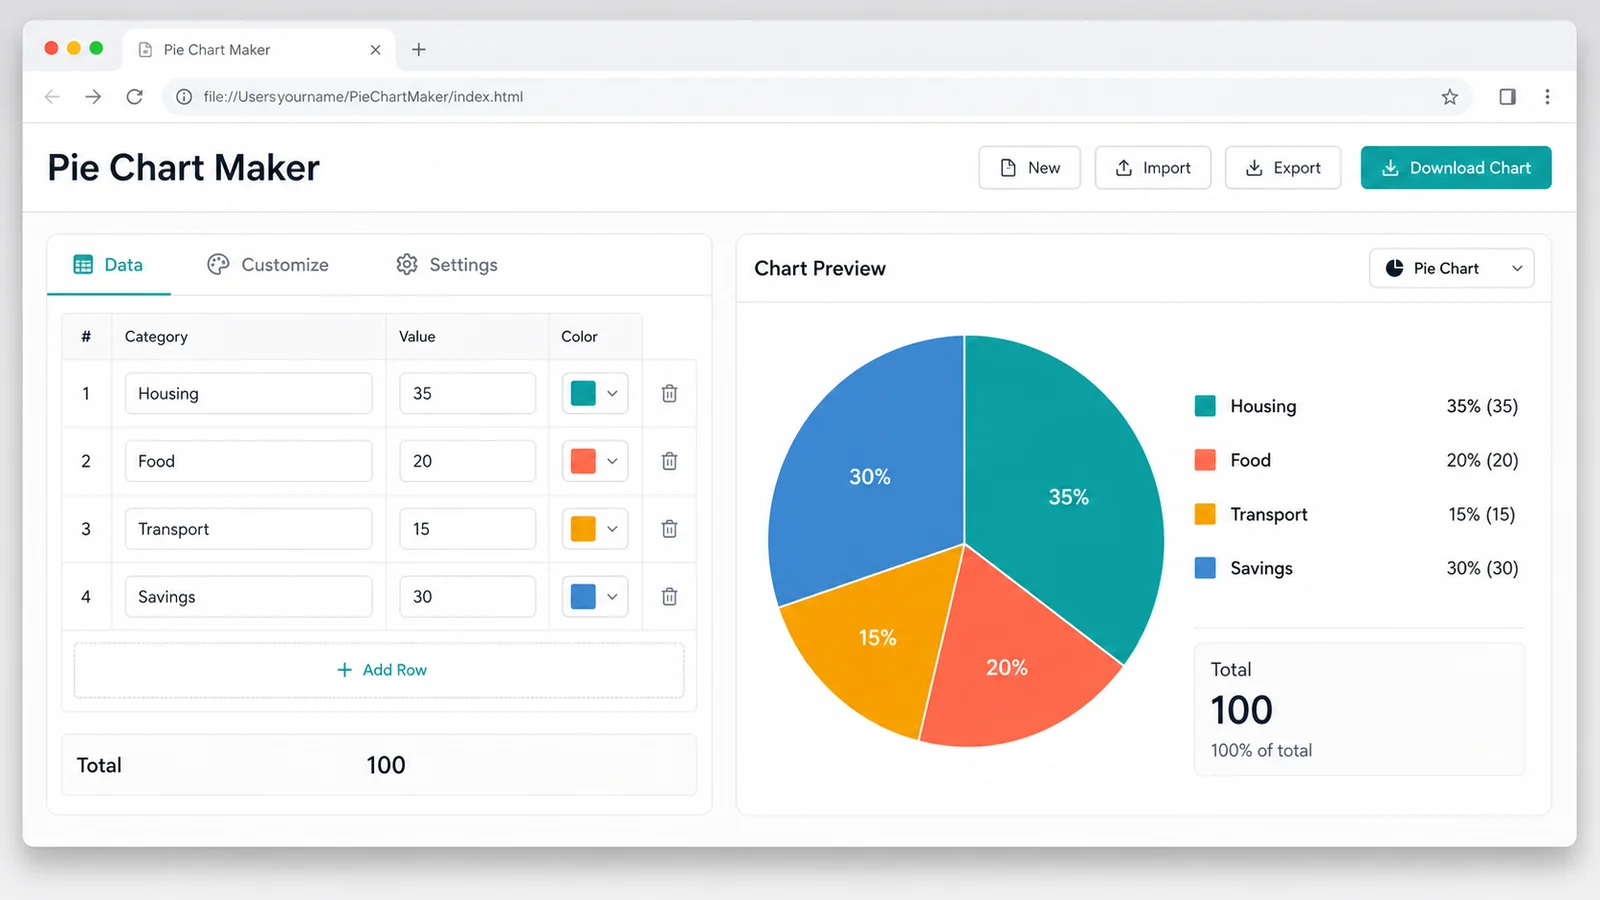
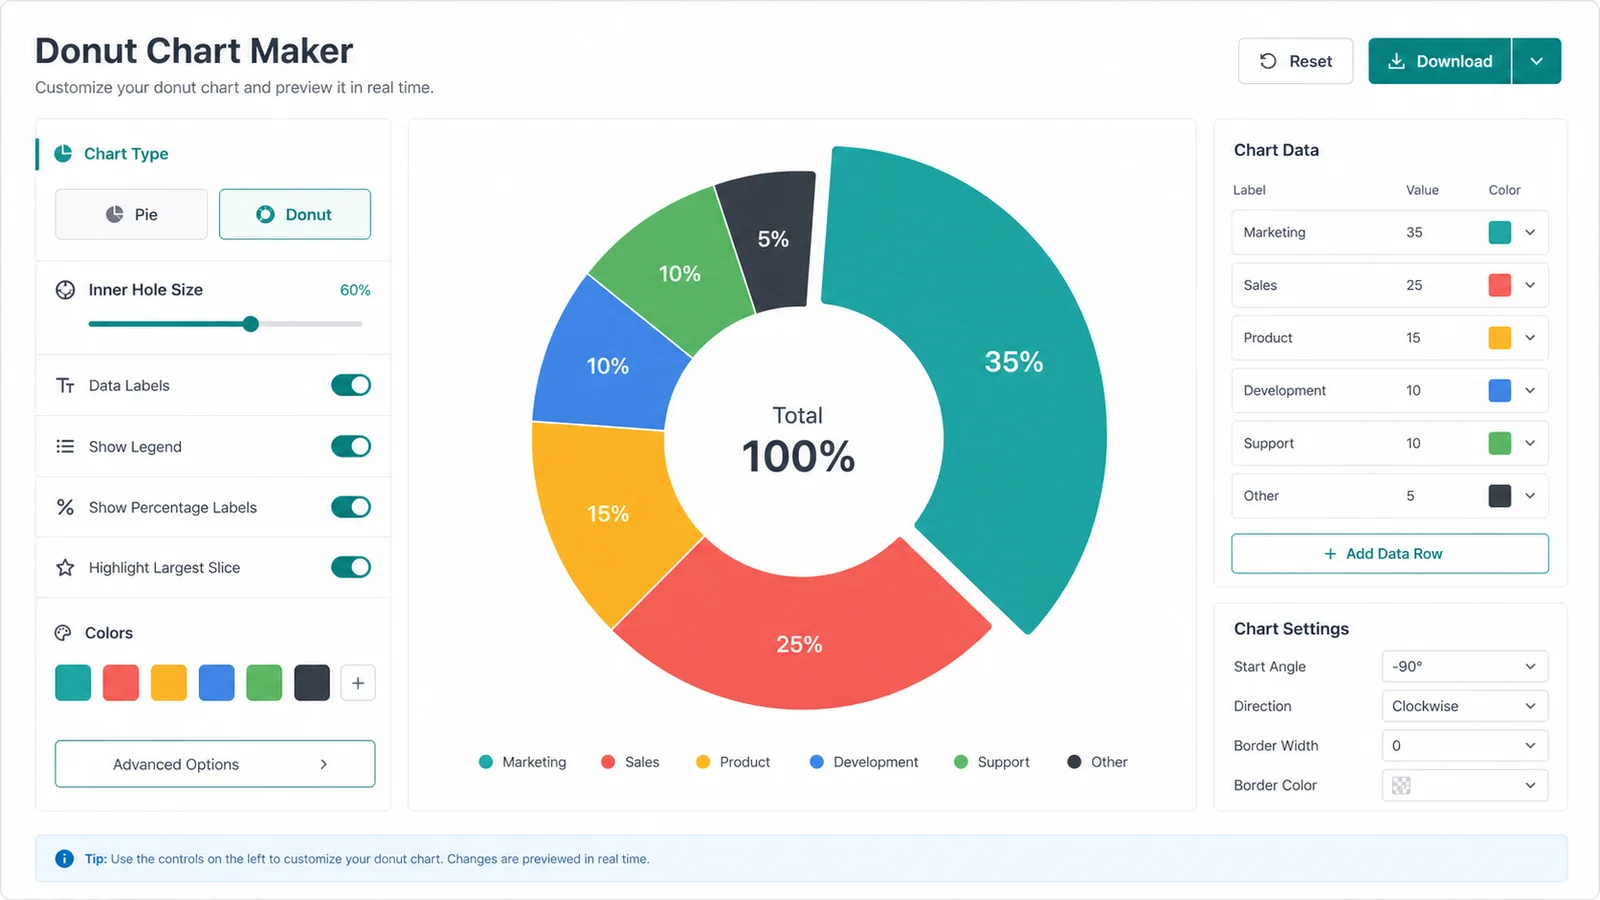
Use one Pie Chart Maker as a Donut Chart Maker and Percentage Chart Maker. Switch chart type, adjust donut hole size, edit labels, legend, percentages, colors, background, slice gaps, start angle, and largest-slice highlight.
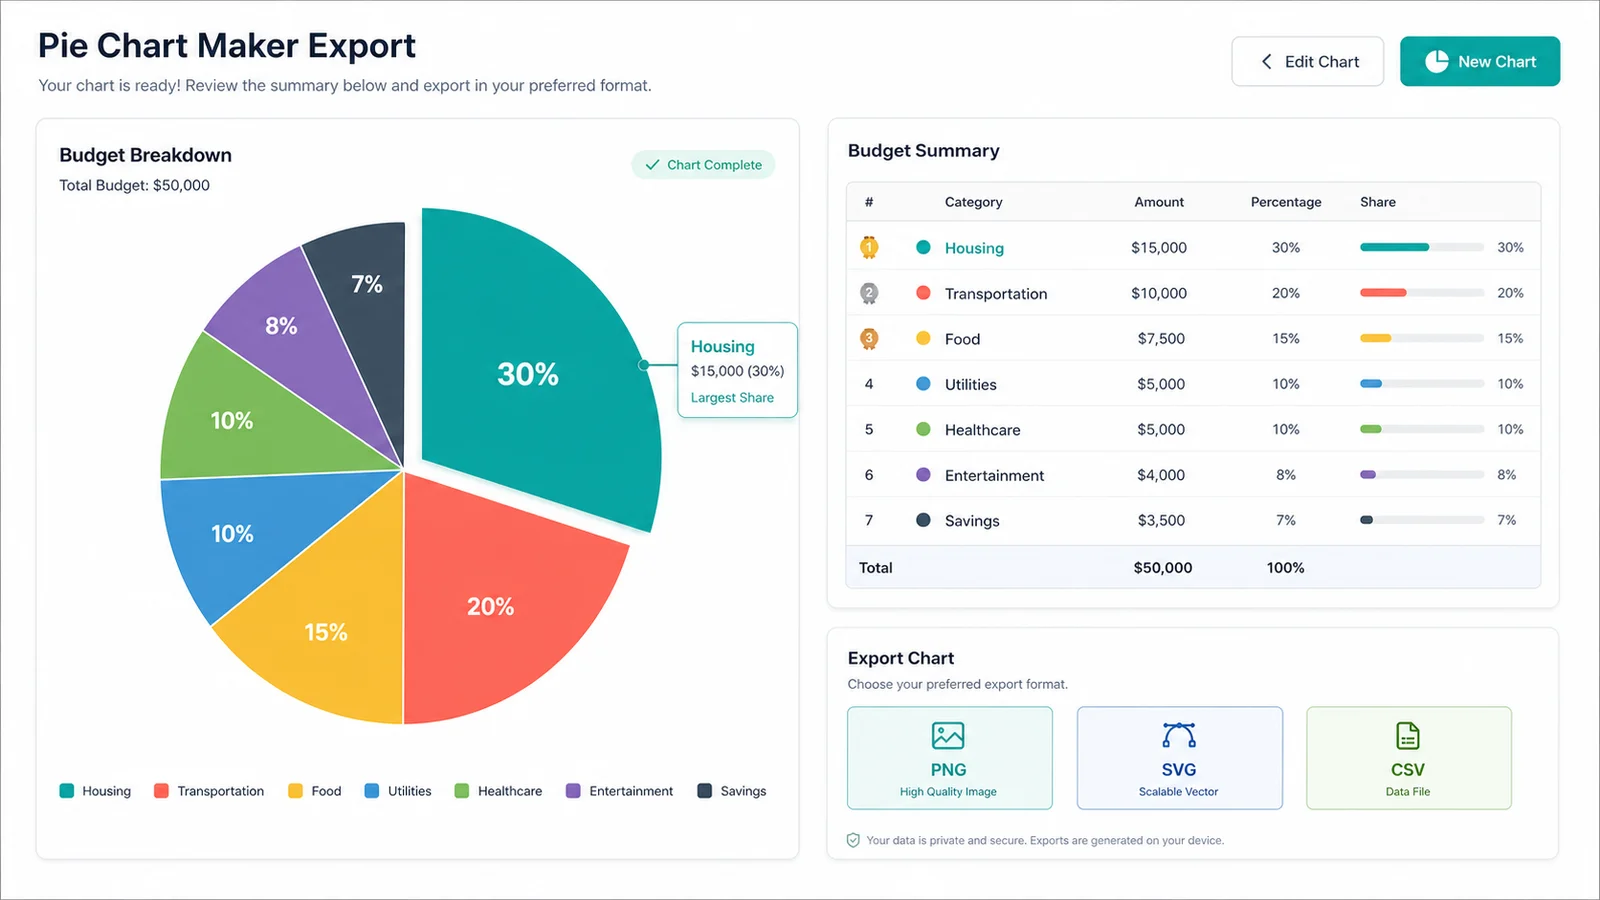
Create finished files for slides, reports, documents, blog posts, social graphics, and printed summaries. The Pie Chart Maker downloads PNG, SVG, cleaned CSV data, or an editable JSON file you can import later.
Use one Pie Chart Maker page for pie charts, donut charts, percentage charts, budget breakdowns, and survey result charts instead of splitting the same part-to-whole workflow across smaller tools.
Show rent, food, transport, savings, subscriptions, and other expenses as clear shares of a monthly or project budget.
Turn hours, days, or effort estimates into a visual time distribution for work, study, projects, or routines.
Summarize questionnaire answers, poll choices, votes, ratings, or feedback categories with percentages and a data table.
Switch from pie to donut mode when you want a modern ring chart with a center total and compact legend.
Enter raw values or percentages and let the browser calculate shares, total, ranking, labels, and the largest category.
The Pie Chart Maker does not connect to databases, bank accounts, ad platforms, analytics accounts, market data APIs, or live dashboards. Your chart data stays in your browser.
Use this Pie Chart Maker when you need a quick part-to-whole chart, not automatic market share lookup, financial statement analysis, bank account connection, ad platform import, or a real-time statistics dashboard.
Paste or type two columns: category name and value. The Pie Chart Maker accepts raw numbers, currency values, and percentage-like values, then calculates each category share from the total.
Sort shares, keep Top 5 or Top 10, merge smaller rows into Other, then pick pie chart or donut chart mode. Add labels, percentages, values, legend, largest-share highlight, source note, colors, and export size.
Download PNG for slides and documents, SVG for scalable graphics, CSV for the cleaned table summary, or JSON to edit the chart later. The Pie Chart Maker calculates everything locally in the browser.
This pure front-end editor does not upload data or fetch online results.
Answers to practical questions about data input, percentages, donut charts, privacy, exports, and the limits of this browser-based Pie Chart Maker.
Yes. This Pie Chart Maker includes pie charts, donut charts, percentage labels, totals, ranking, legends, and exports because those tools share the same goal: showing the parts of a whole.
Yes. Enter budget categories such as rent, groceries, transport, savings, or software costs. The Pie Chart Maker calculates the percentage for each budget part and highlights the largest share.
Yes. Enter answer choices and response counts. The editor converts responses into percentages, creates a legend, ranks the shares, and exports PNG, SVG, or CSV for reports and presentations.
No. You can enter raw counts, money amounts, hours, votes, or proportions. The Pie Chart Maker calculates each percentage from the total. If your values already add to 100, the chart will preserve those proportions.
Pie charts are easiest to read with a small number of categories. If you have many rows, use Top 5 or Top 10 and merge the rest into Other so the chart stays readable.
Yes. Choose the transparent PNG size preset or set the background to transparent, then download PNG. You can also export SVG for scalable chart artwork or CSV for the table summary.
Yes. The Pie Chart Maker runs locally in your browser. It does not upload your data, require an account, connect to a database, or look up online data.
It does not perform automatic market share lookup, financial report analysis, consumer account connection, ad platform data reading, or real-time statistics dashboards. Those workflows need external databases, account authorization, or third-party APIs.
Yes. Charts you create can be used in commercial reports, business presentations, school projects, websites, print material, and social posts.
Use a pie chart when the main point is how a whole is divided into parts. Use a bar chart when exact category comparison, ranking, or many labels matter more than the part-to-whole relationship.
Open the Pie Chart Maker, enter category names and values, choose pie or donut mode, review percentages, ranking, total, legend, and table summary, then export PNG, SVG, or CSV.
No account connection, no database, no online lookup - just a focused browser tool for clear part-to-whole charts.
Free forever. Your Pie Chart Maker data stays local in your browser.