Learning Progress Line Charts
Track study hours, reading progress, lesson completion, scores, or practice totals across weeks and export a clean progress line graph.
Free Line Chart Maker
Your line chart is generated locally in your browser. No live market data, analytics account, or database connection is required. This Line Chart Maker also works as a Trend Chart Maker, Time Series Chart Maker, Progress Line Graph Maker, and Simple Line Graph Maker for learning progress, budgets, weight records, website visits, sales changes, temperature logs, habit tracking, and project progress.
One page for trend charts, time series charts, progress line graphs, and simple line graphs.
Manually enter time, stage, or sequence labels with numeric values, then create a Trend Chart Maker, Time Series Chart Maker, Progress Line Graph Maker, or Simple Line Graph Maker output with a timeline, value axis, data points, trend line, highest and lowest value markers, moving average options, data table summary, and PNG, SVG, or CSV export.
This chart maker is built around one clear search intent: show how numbers change across time, stages, or an ordered sequence with a readable trend line chart.
Copy rows from a spreadsheet, CSV, TSV, or type a simple Time | Value table. The editor detects a timeline column, one or more numeric series, duplicate labels, and non-numeric values before drawing the chart.
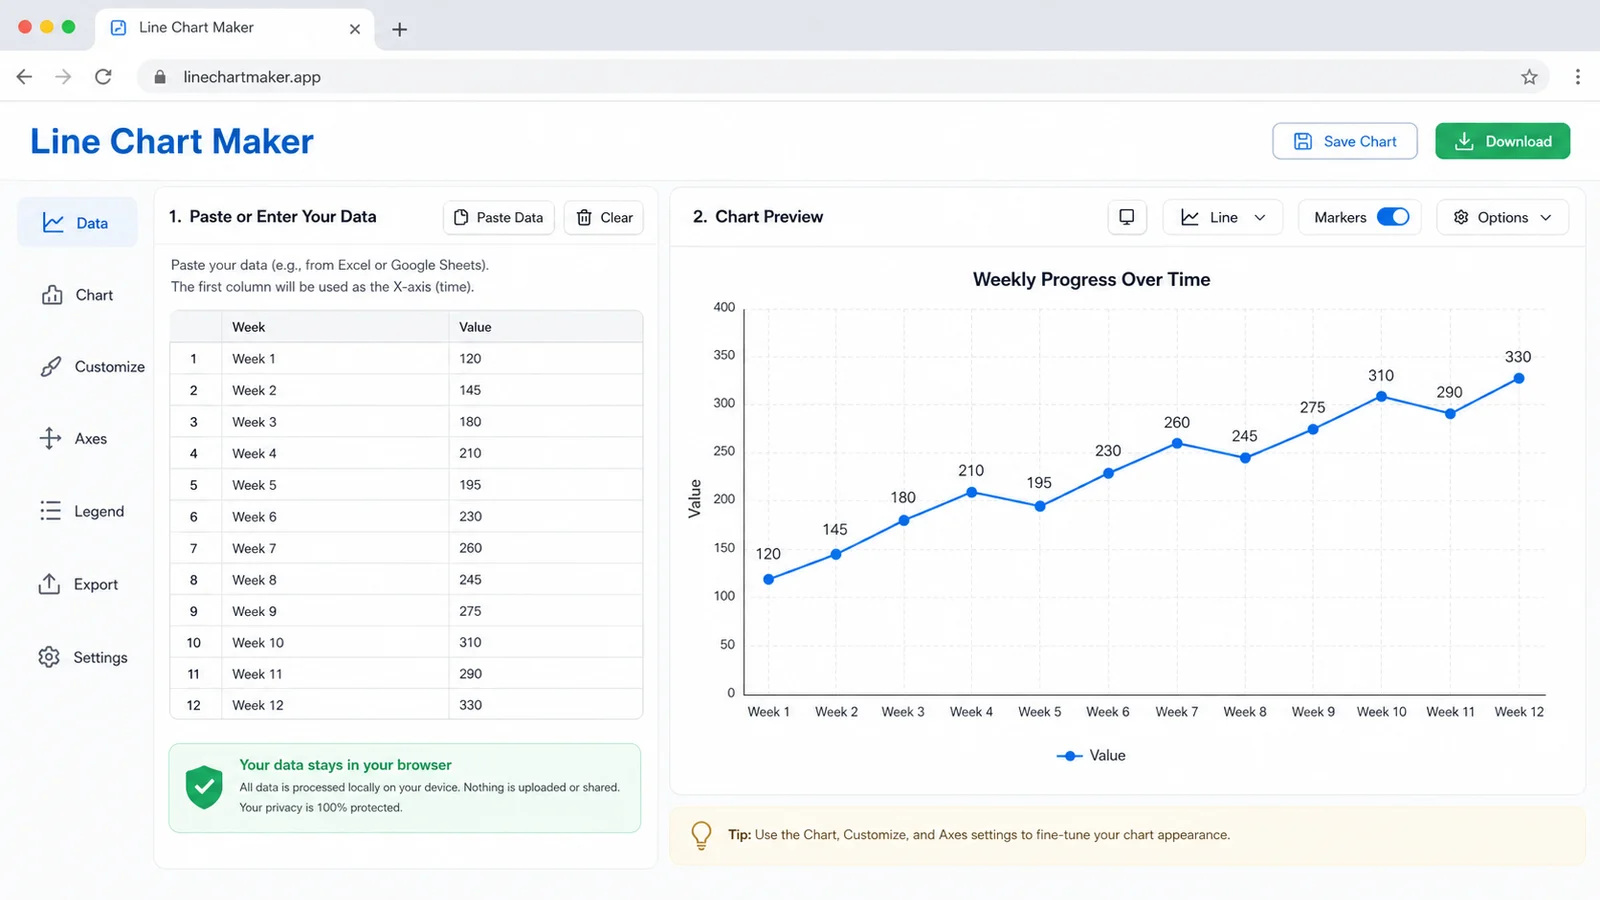
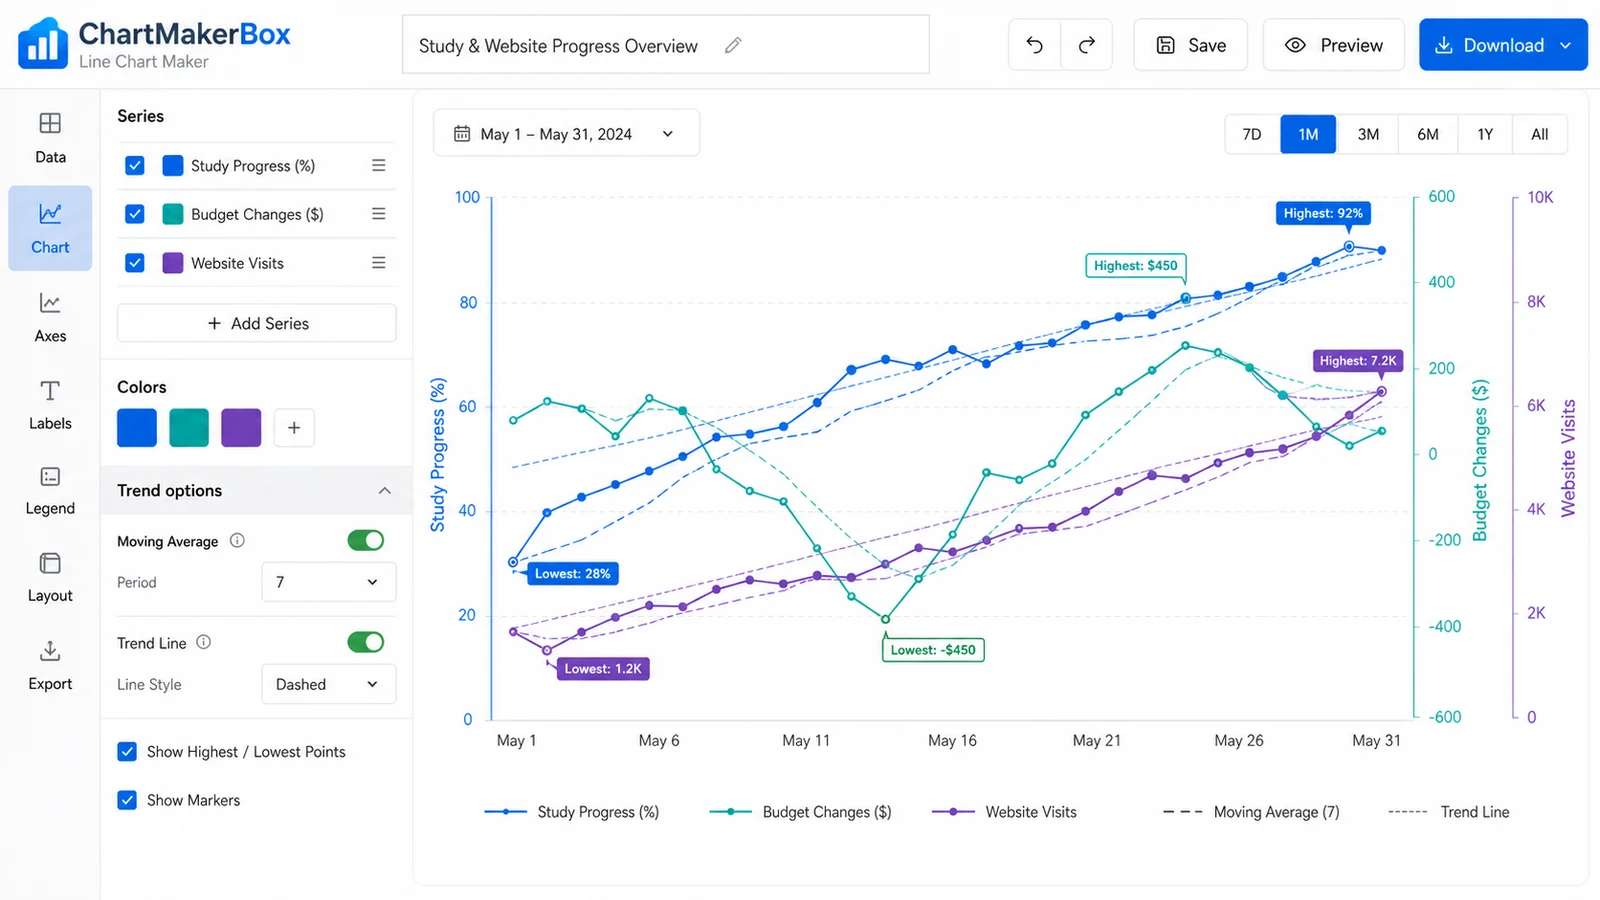
Use this editor for a single-line chart, multi-line chart, progress line graph, and simple time series chart. Add data points, labels, a trend line, highest and lowest markers, moving averages, axes, legends, and colors.
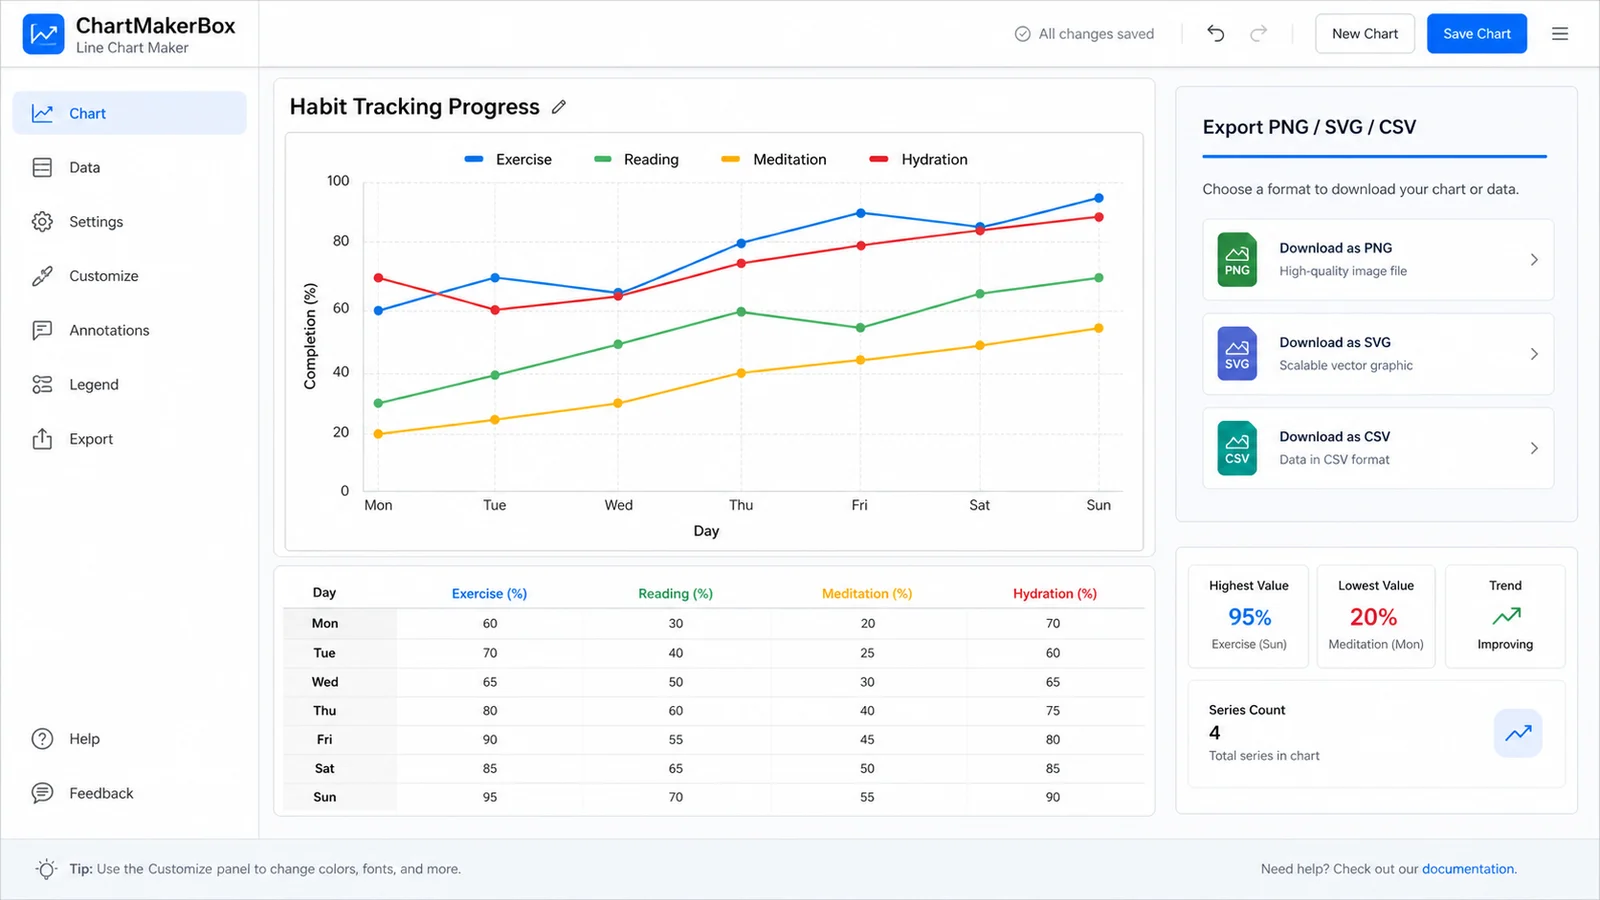
Download PNG for slides, SVG for scalable documents, CSV for the cleaned data table summary, or JSON to edit later. The editor is practical for static trend visuals, not live market feeds or connected dashboards.
Use one page as a Trend Chart Maker, Time Series Chart Maker, Progress Line Graph Maker, and Simple Line Graph Maker instead of splitting the same trend-over-order workflow across smaller tools.
Track study hours, reading progress, lesson completion, scores, or practice totals across weeks and export a clean progress line graph.
Enter monthly savings, spending, balances, or category totals to show budget movement without connecting a bank account or database.
Create weight records, habit streaks, sleep logs, workout totals, hydration records, and other personal tracking line charts.
Paste manual visit counts by day, week, channel, or campaign when you need a static website traffic trend chart, not automatic Analytics access.
Show sales changes, project progress, milestone completion, task counts, issue counts, and other ordered business metrics.
The tool does not fetch stock prices, crypto prices, live monitoring data, Analytics accounts, database trend reports, or predictive models. Your pasted data stays in your browser.
Use this tool when you have manual or pasted values and need a readable trend chart, not a stock chart, cryptocurrency chart, live monitoring dashboard, Analytics connector, database trend report, or forecasting model.
Paste one time, stage, or sequence column plus one or more numeric columns. Keep a header row so the editor can name each series in the legend.
Choose single-line or multi-line mode, then turn on data points, value labels, trend lines, highest and lowest markers, moving average, gridlines, axes, legends, and number formatting.
Choose a presentation, report, blog, square, transparent PNG, or print-friendly size. Download PNG for slides, SVG for scalable graphics, CSV for the data table summary, or JSON to edit later.
The editor saves locally in your browser and does not upload chart data to a server.
Answers to practical questions about data input, trend options, privacy, exports, mobile use, and tool limits.
Yes. This page keeps Trend Chart Maker, Time Series Chart Maker, Progress Line Graph Maker, and Simple Line Graph Maker intent together because they all show numeric values changing across time, stages, or ordered steps.
Use the first column for time, stage, date, week, month, step, or sequence labels. Use the next column for a single-line chart, or add more numeric columns for a multi-line chart. CSV, TSV, pipe-separated rows, and pasted spreadsheet cells are supported.
Yes. Add multiple numeric columns after the first label column. The editor draws each numeric column as a separate line, creates a legend, and lets you edit colors for each series.
Yes. You can add a dashed trend line, turn on a moving average, set the moving average period, show data points, and mark the highest and lowest values.
No. This tool does not fetch stock prices, crypto prices, candles, order books, or live market data. Those workflows need real-time data sources and finance-specific chart rules.
No. The tool does not connect to Google Analytics, Search Console, ad accounts, databases, or BI systems. Paste the values you want to chart, and the browser creates the line chart locally.
Yes. Choose the transparent PNG preset or set the background to transparent, then download PNG. You can also export SVG for scalable chart artwork and CSV for the cleaned data table summary.
Yes. It runs in your browser. It does not upload pasted data, require sign-up, or connect to a database. Browser local storage is used only for your saved draft.
Yes. Exported charts are yours to use in reports, business presentations, school projects, websites, print material, and social posts.
It is not a real-time monitoring dashboard, database trend report builder, automatic analytics reader, stock or cryptocurrency chart, or predictive model. Those need third-party APIs, databases, streaming data, or complex algorithms.
Paste or manually enter time, stage, or sequence data, choose single-line or multi-line mode, add trend details, and export a polished PNG, SVG, or CSV in minutes.
No live market data, no analytics account, no database connection, and no forecasting model - just a focused chart maker for clear trend visuals.
Free forever. Your line chart data stays local in your browser.