Sales Funnel Maker
Use the Funnel Chart Maker to turn leads, qualified leads, demos, proposals, and won deals into a readable sales funnel with conversion and drop-off rates.
Free Funnel Chart Maker
Your funnel chart is generated locally in your browser. No analytics account, ad account, CRM, payment system, or database connection is required. This Funnel Chart Maker combines Sales Funnel Maker, Conversion Funnel Chart Maker, Marketing Funnel Diagram Maker, Signup Funnel Maker, and Recruitment Funnel Chart Maker intent in one manual stage-conversion workflow.
This Funnel Chart Maker is built for sales pipelines, registration funnels, marketing flows, user drop-off reviews, hiring pipelines, resume screening, ecommerce purchase paths, and content conversion paths.
Manually enter funnel stages and quantities or ratios, then let the Funnel Chart Maker calculate stage share, stage conversion rate, drop-off rate, largest drop-off step, stage descriptions, a funnel chart, a table summary, and export-ready PNG, SVG, or CSV files.
The Funnel Chart Maker focuses on one clear search intent: stage-by-stage conversion funnels where every stage has a name, a quantity or ratio, and an optional explanation.
Paste CSV, TSV, spreadsheet rows, or type stage names, quantities, and descriptions. The Funnel Chart Maker calculates stage share, conversion rate, drop-off rate, overall conversion, and the largest drop-off step without connecting to any external account.
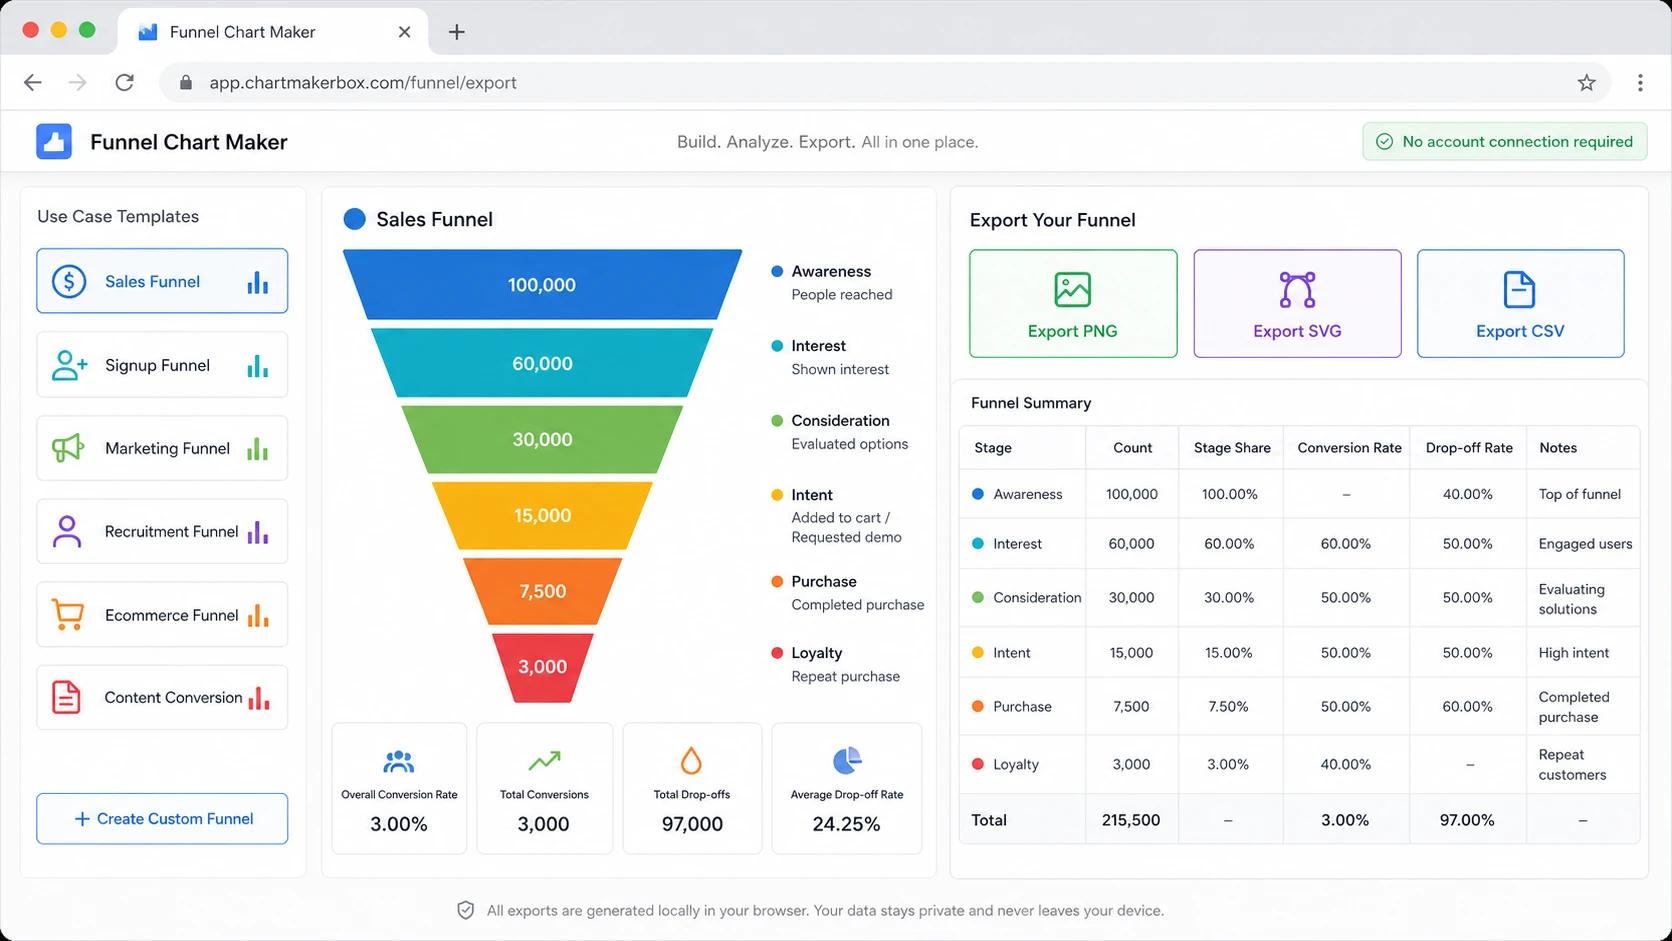
One Funnel Chart Maker covers Sales Funnel Maker, Conversion Funnel Chart Maker, Marketing Funnel Diagram Maker, Signup Funnel Maker, Recruitment Funnel Chart Maker, ecommerce purchase path, and content conversion path use cases through templates.
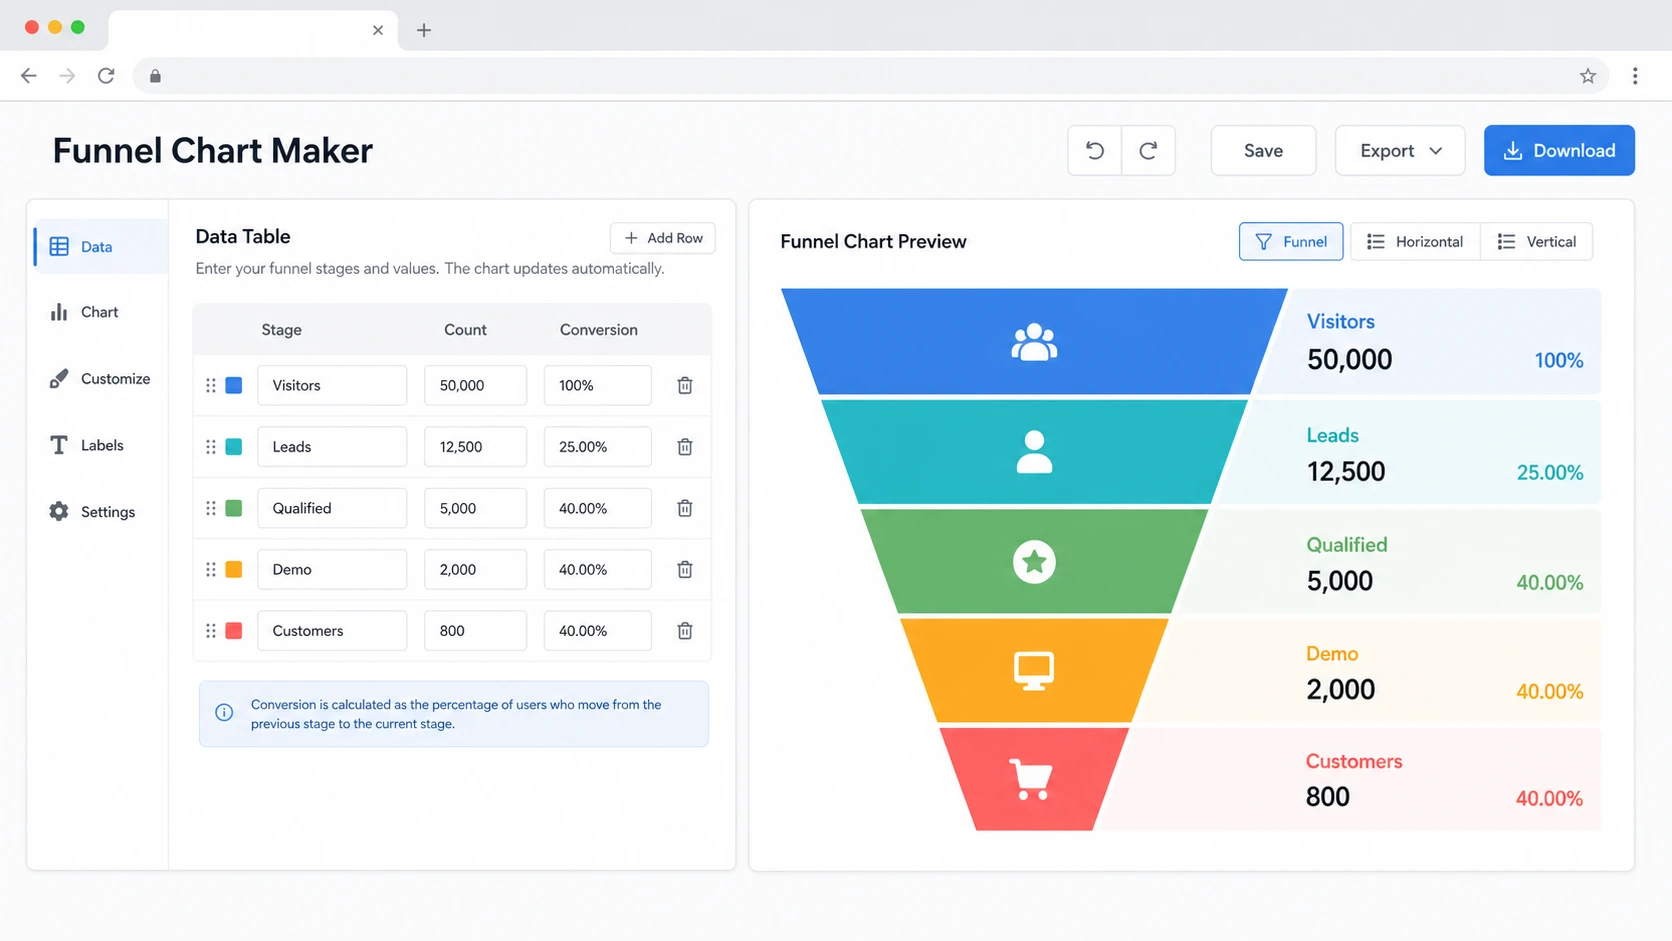
Download the Funnel Chart Maker output as PNG or SVG for slides, reports, docs, and blog posts. Export CSV when you need the table summary with stage quantity, stage share, conversion rate, drop-off rate, and stage descriptions.
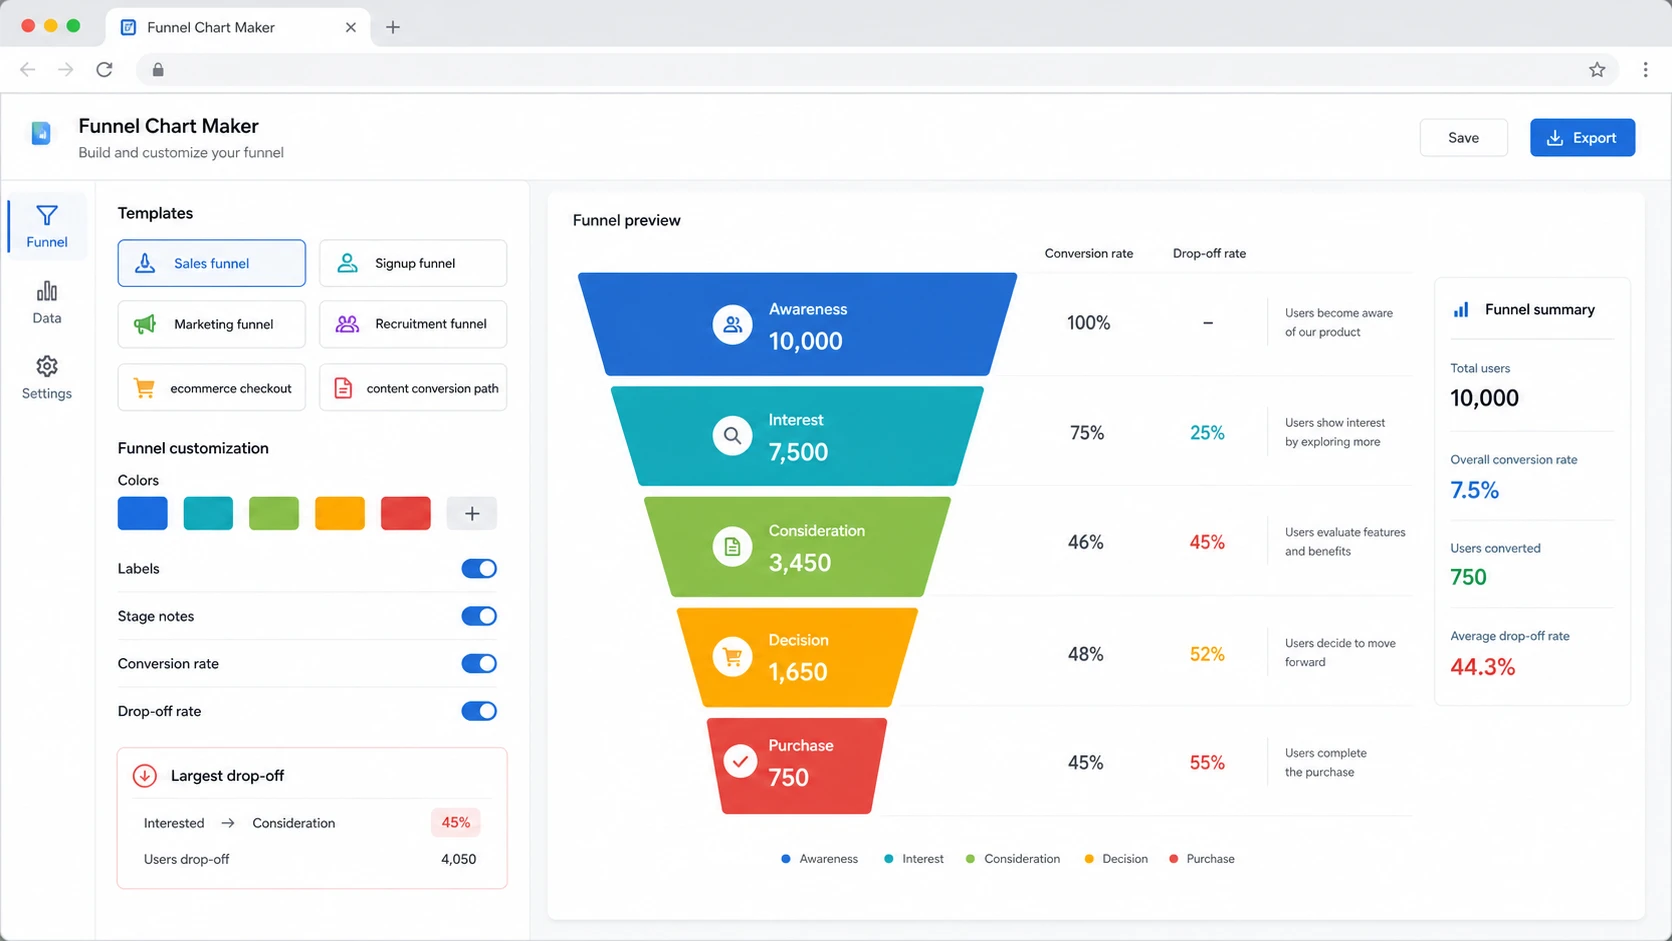
Use one Funnel Chart Maker page for stage conversion funnels instead of splitting the same core workflow into separate sales, signup, marketing, recruitment, ecommerce, or content funnel tools.
Use the Funnel Chart Maker to turn leads, qualified leads, demos, proposals, and won deals into a readable sales funnel with conversion and drop-off rates.
Use the Funnel Chart Maker to map visits, signup starts, verification, onboarding completion, and activation so product teams can explain registration conversion manually.
Use the Funnel Chart Maker to visualize awareness, clicks, leads, qualified interest, and sales conversations from a manual campaign report.
Use the Funnel Chart Maker to show resume submissions, screening, calls, interviews, and offers in a hiring pipeline chart.
Use the Funnel Chart Maker to compare product views, add-to-cart events, checkout starts, payment steps, and completed orders from manually entered totals.
The Funnel Chart Maker does not connect to Google Analytics, ad accounts, CRMs, Shopify, Stripe, databases, or live tracking systems. The Funnel Chart Maker keeps your stage data in the browser.
The Funnel Chart Maker is intentionally simple: enter stage data by hand, review the calculated conversion summary, customize the visual, then export the chart and table.
In the Funnel Chart Maker, type or paste one row per stage. Use columns for stage name, quantity or ratio, and an optional stage description.
Review Funnel Chart Maker stage share, conversion rate, drop-off rate, overall conversion, largest drop-off, stage descriptions, and table summary before exporting.
Choose a Funnel Chart Maker size preset, theme, stage colors, labels, descriptions, number format, and background for your slide, report, document, or post.
The transparent PNG preset is useful when you want to place the funnel chart over a custom slide or report background.
Download Funnel Chart Maker PNG for quick sharing, SVG for crisp editing, CSV for the stage table, or JSON when you want to continue editing the same funnel later.
Answers about data format, privacy, exports, limitations, and when this Funnel Chart Maker is the right tool.
The Funnel Chart Maker accepts manually typed or pasted rows with a stage name, a numeric quantity or ratio, and an optional description. You can paste TSV, CSV, semicolon-separated, or pipe-separated data from a spreadsheet.
Yes. The Funnel Chart Maker intentionally combines those related tools because the core task is the same: show ordered stages, quantities, conversion rates, drop-off rates, and the largest drop-off. Templates cover sales, signup, marketing, recruitment, ecommerce, and content flows.
No. The Funnel Chart Maker is a pure front-end tool. It does not connect to Google Analytics, ad accounts, CRMs, Shopify, Stripe, databases, payment systems, or live conversion data. You enter the data manually.
No. The Funnel Chart Maker calculates chart metrics only: stage share, stage conversion, drop-off, largest drop-off, and table summaries. It does not do automated commercial analysis, campaign recommendations, attribution modeling, or user behavior tracking.
You can export a PNG image, an SVG file, a CSV summary, or a JSON file for later editing. The CSV includes funnel stage, quantity, stage share, conversion rate, drop-off rate, and stage description.
Yes. The Funnel Chart Maker is responsive and works on phones, tablets, and desktops. A larger screen is easier when editing many stages or reviewing the table summary.
The Funnel Chart Maker runs locally in your browser. The stage data you type is not uploaded by the tool. Local save uses your browser storage so you can continue editing on the same device.
Use the Funnel Chart Maker to turn manual stage data into a clean funnel chart, conversion summary, and exportable table.
Sales, signup, marketing, recruitment, ecommerce, and content funnels can all live in one simple browser-local workflow.
Free forever. No sign-up, no account connection, no external data pull.