Matrix Diagram Maker for priority judgment
Use the Matrix Diagram Maker as an Impact Effort matrix to compare impact, effort, and quick wins before planning a sprint or project backlog.
Free Matrix Diagram Maker
Your matrix diagram is generated locally in your browser. No external business data, market data, or account connection is required. This Matrix Diagram Maker combines SWOT Matrix Maker, Eisenhower Matrix Maker, Impact Effort Matrix Maker, Risk Reward Matrix Maker, Value Cost Matrix Maker, and Custom 2x2 Matrix Maker intent into one focused 2x2 quadrant tool.
One Matrix Diagram Maker for priority judgment, strategy analysis, risk assessment, time management, product decisions, and personal planning.
Choose a matrix template or customize the X axis, Y axis, quadrant titles, labels, and priority guidance. Enter projects, tasks, ideas, or factors with X/Y scores, then the Matrix Diagram Maker places each item onto a printable 2x2 quadrant canvas with labels, classification results, priority advice, PNG export, SVG export, and Markdown copy.
The Matrix Diagram Maker keeps related 2x2 frameworks together, so you can switch from strategy to priority to risk without opening a separate tool page.
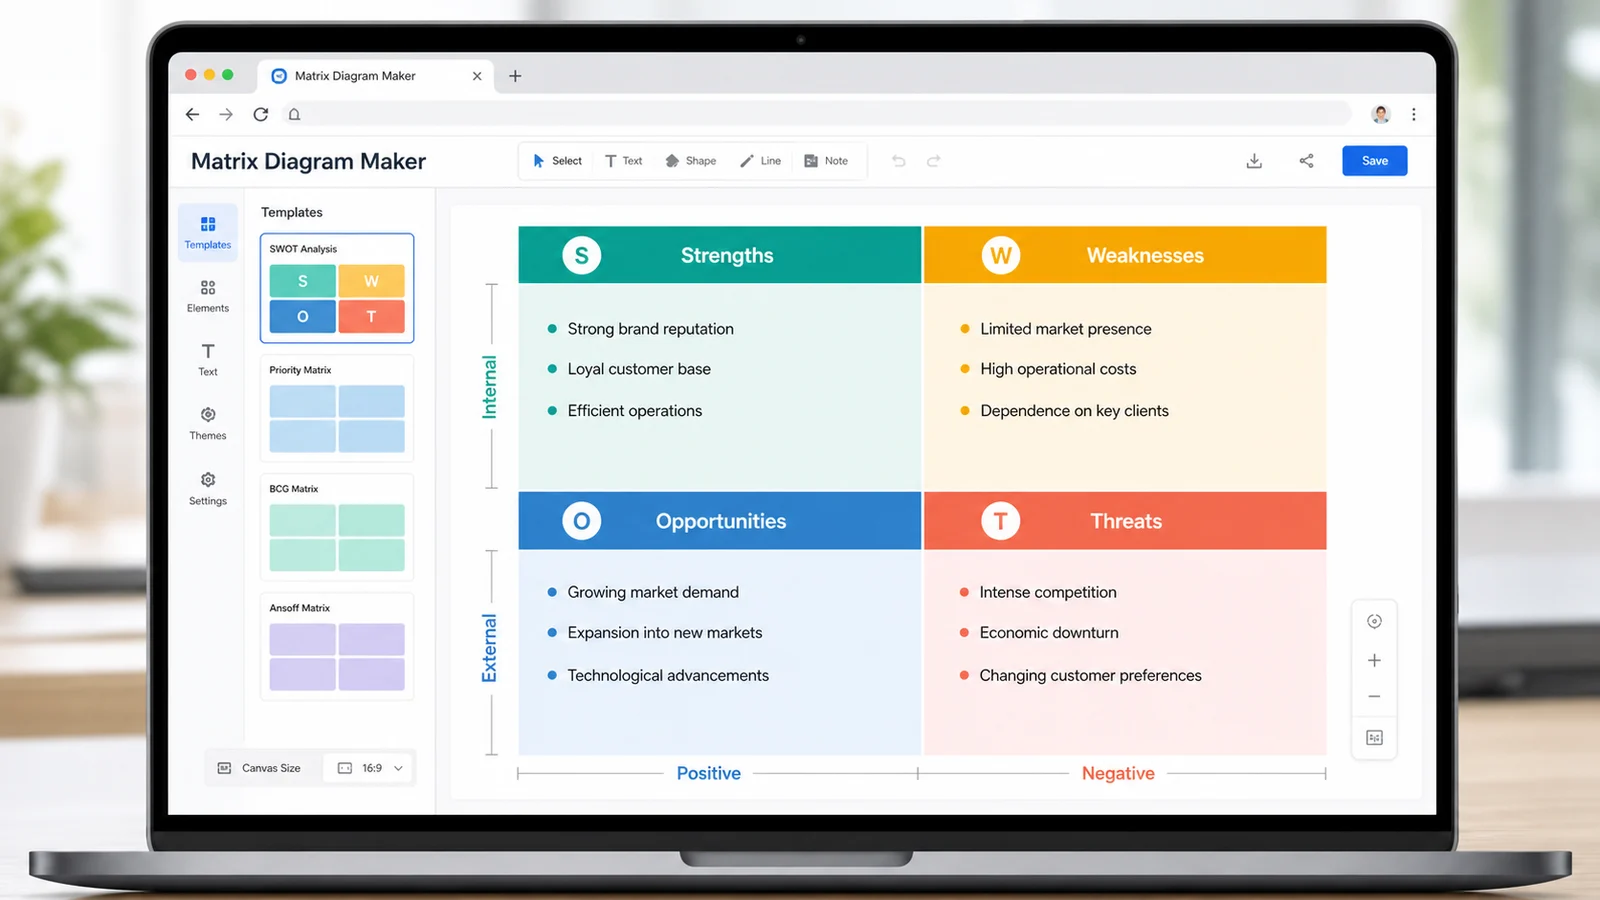
Open SWOT, Eisenhower, Impact Effort, Risk Reward, Value Cost, or Custom 2x2 Matrix Maker presets. Each template loads axis labels, quadrant titles, sample items, and practical advice you can rewrite.
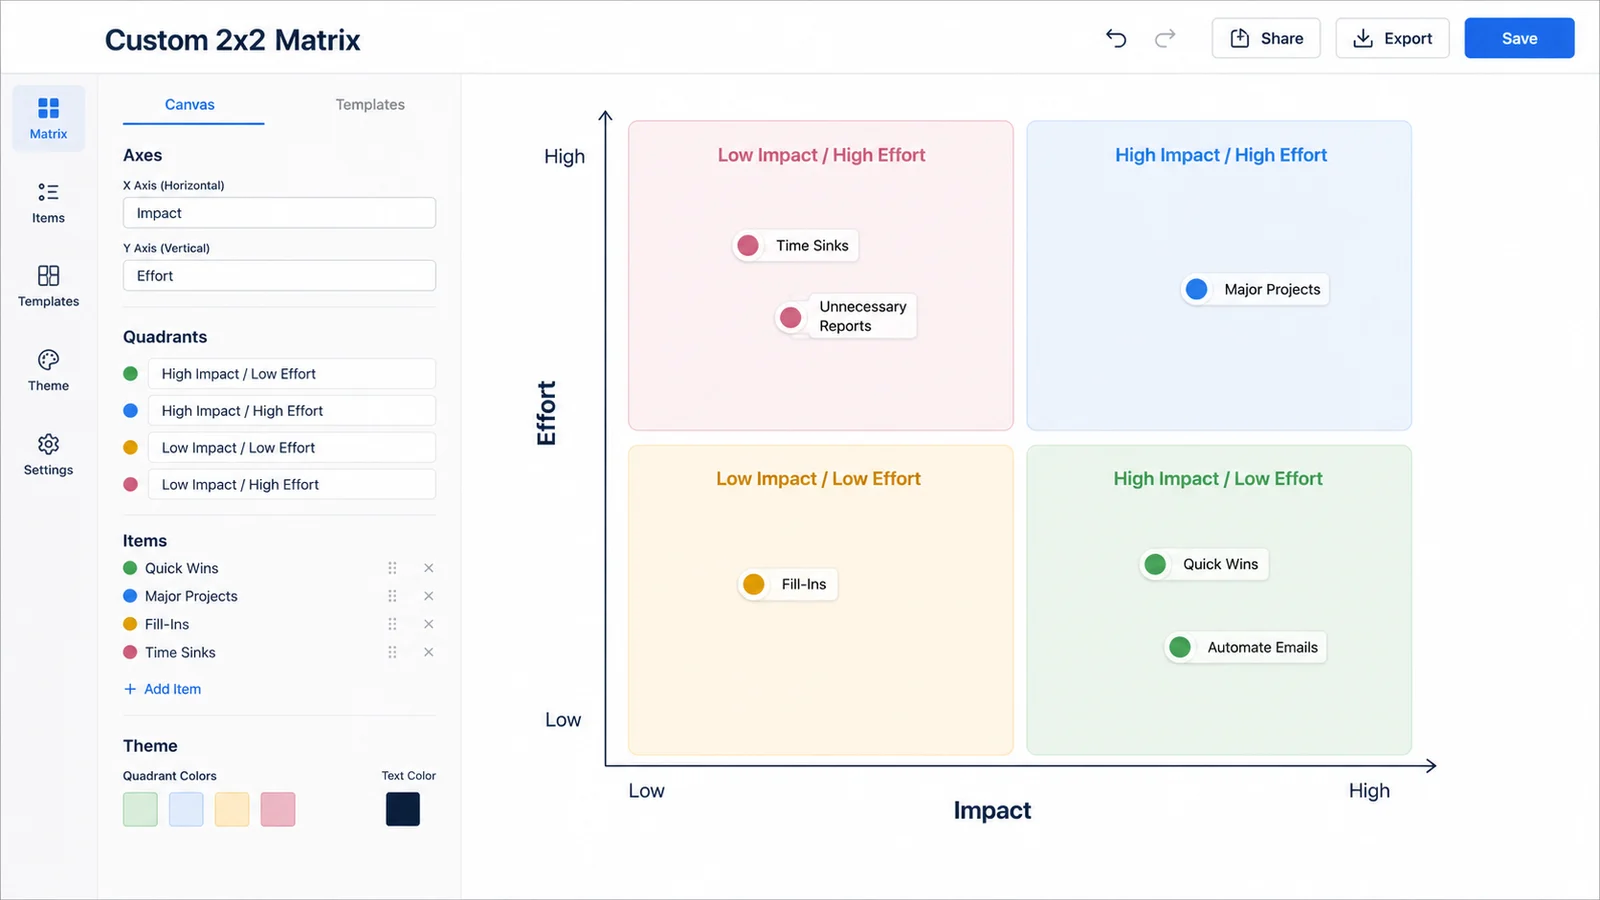
Rename the X axis, Y axis, low and high labels, quadrant titles, and advice lines. The Matrix Diagram Maker supports project priorities, product calls, risk reviews, personal planning, and any custom 2x2 matrix.
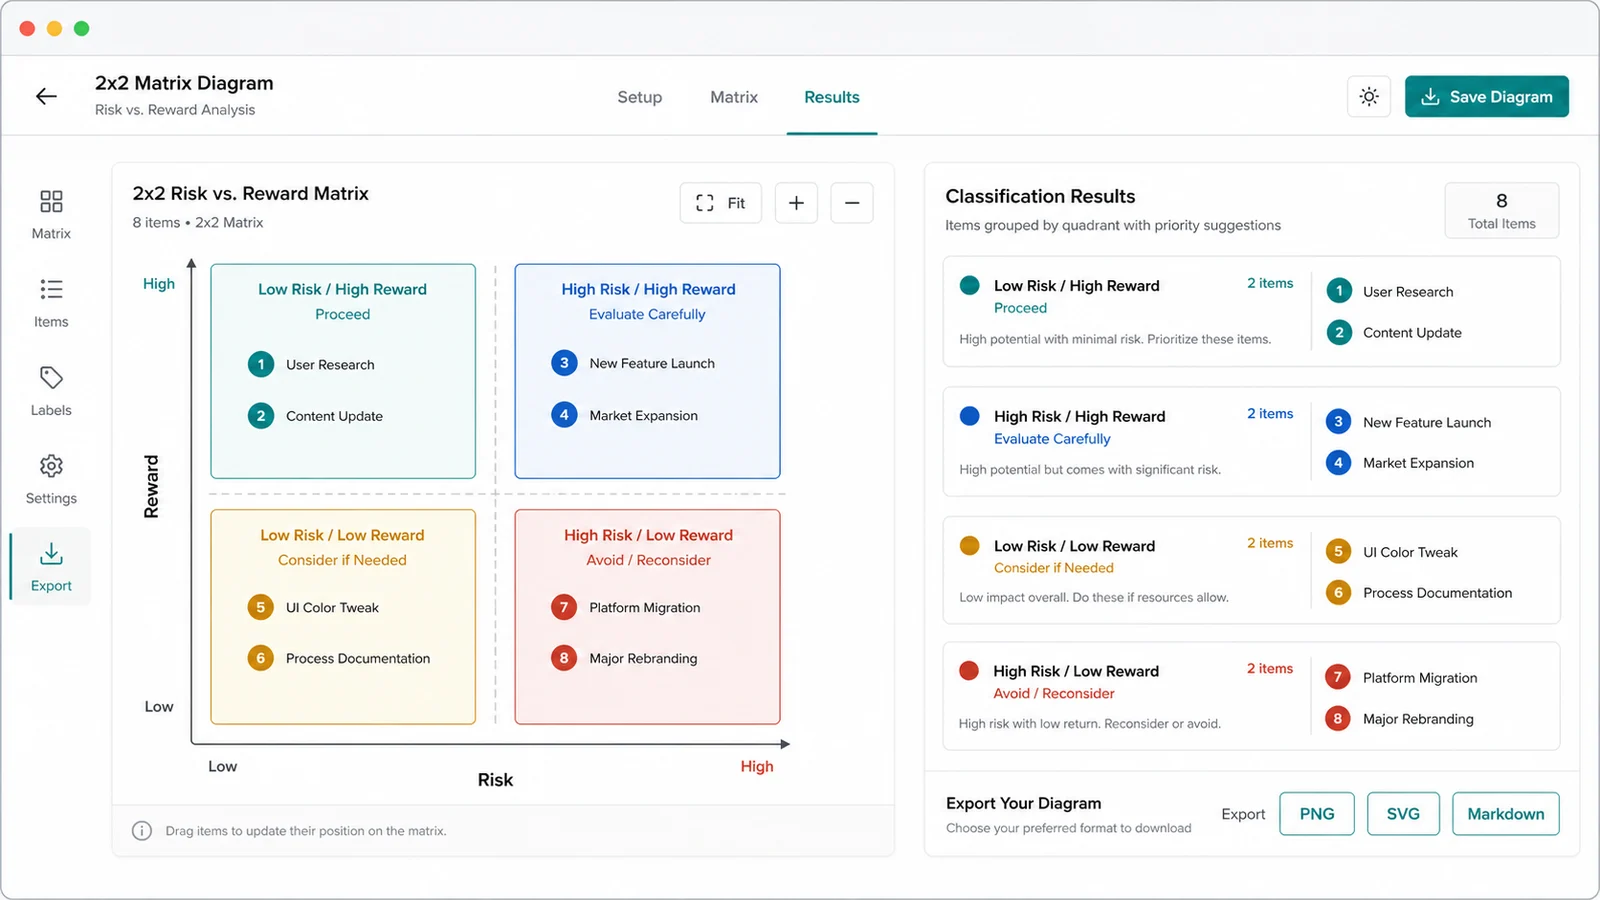
The printable canvas shows the 2x2 matrix, item points, labels, quadrant classification, and priority advice. Export the Matrix Diagram Maker canvas as PNG or SVG, or copy a Markdown summary.
A Matrix Diagram Maker is most useful when the same visual pattern can serve many decision contexts without splitting users across thin pages.
Use the Matrix Diagram Maker as an Impact Effort matrix to compare impact, effort, and quick wins before planning a sprint or project backlog.
Use the Matrix Diagram Maker as a SWOT matrix for strengths, weaknesses, opportunities, and threats without pulling live market data.
Use the Matrix Diagram Maker as a Risk Reward matrix to compare risk and potential payoff using scores your team already agrees on.
Use the Matrix Diagram Maker as an Eisenhower matrix to sort urgent and important work into do, schedule, delegate, and eliminate groups.
Use the Matrix Diagram Maker as a Value Cost matrix when product ideas need a simple view of user value, cost, complexity, and tradeoffs.
Use the Matrix Diagram Maker as a custom 2x2 matrix for habits, goals, career choices, learning plans, or personal project tradeoffs.
The Matrix Diagram Maker is a local visual decision tool. It helps you structure thinking, but it does not fetch data or decide for you.
Start with SWOT, Eisenhower, Impact Effort, Risk Reward, Value Cost, or Custom 2x2. The template only sets labels and examples; you can change every axis and quadrant.
Add projects, tasks, ideas, or factors. Provide X and Y scores from 0 to 100 based on your own judgment, survey, workshop, or prepared notes.
Check the 2x2 matrix, item points, label explanation, classification results, and quadrant advice. Treat suggestions as labels for discussion, not automated strategy scoring.
Download a PNG for presentations, an SVG for crisp design workflows, or copy Markdown for notes, decision logs, issue trackers, and planning docs.
For repeatable workshops, save a local draft and keep one custom template for your team.
Common questions about using a browser-local Matrix Diagram Maker for 2x2 quadrant decisions.
No. The Matrix Diagram Maker combines SWOT Matrix Maker, Eisenhower Matrix Maker, Impact Effort Matrix Maker, Risk Reward Matrix Maker, Value Cost Matrix Maker, and Custom 2x2 Matrix Maker use cases because they share the same 2x2 quadrant structure.
You can paste item rows as TSV, CSV, or pipe-separated text. The recommended columns are Item, X, Y, Tag, and Note. X and Y are 0-100 scores that place each point on the matrix.
No. The Matrix Diagram Maker classifies items from the X/Y scores you provide. It does not perform business data analysis, automated strategic scoring, market scraping, financial forecasting, AI investment advice, or real-time data analysis.
Your matrix diagram is generated locally in your browser. No external business data, market data, or account connection is required, and the tool does not upload your item names, scores, labels, or notes.
Yes. Choose the Custom 2x2 Matrix Maker template or edit any preset. You can rename both axes, low and high labels, all four quadrant titles, item tags, notes, and priority advice.
Yes. You can export PNG, SVG, or Markdown summaries for reports, planning docs, workshops, slides, and internal decision records. The content and scores remain your responsibility.
Open the Matrix Diagram Maker, choose a 2x2 matrix template, and turn projects, tasks, ideas, or factors into a clear quadrant diagram.
Everything runs locally in your browser, with PNG, SVG, and Markdown export when your matrix is ready.
Free forever. No sign-up, no external business data, and no account connection.