Fishbone Diagram Maker for root cause analysis
Use the Fishbone Diagram Maker as a Root Cause Analysis Diagram Maker to organize suspected causes before a team validates evidence and chooses actions.
Free Fishbone Diagram Maker
Your fishbone diagram is generated locally in your browser. No diagnostic data, business system, or external database is connected. This Fishbone Diagram Maker combines Cause and Effect Diagram Maker, Ishikawa Diagram Maker, Root Cause Analysis Diagram Maker, and Problem Cause Diagram Maker intent in one focused page.
One Fishbone Diagram Maker for root cause analysis, problem retrospectives, quality management, project failure reviews, website traffic drops, product bug reviews, and operations issues.
Enter a core problem, organize possible causes by main category, mark key causes with an exclamation point, add improvement notes, and generate a Fishbone Diagram Maker result with a fishbone structure, cause groups, key cause markers, analysis summary, PNG export, SVG export, Markdown copy, and print-ready diagram.
The Fishbone Diagram Maker keeps cause and effect diagram, Ishikawa diagram, root cause analysis diagram, and problem cause diagram search intent together on one stronger page.
Use the Fishbone Diagram Maker to write the problem statement first, then add context for a quality issue, project failure, traffic drop, product bug, or operations problem. The diagram starts from your manual problem statement, not an automated diagnosis.
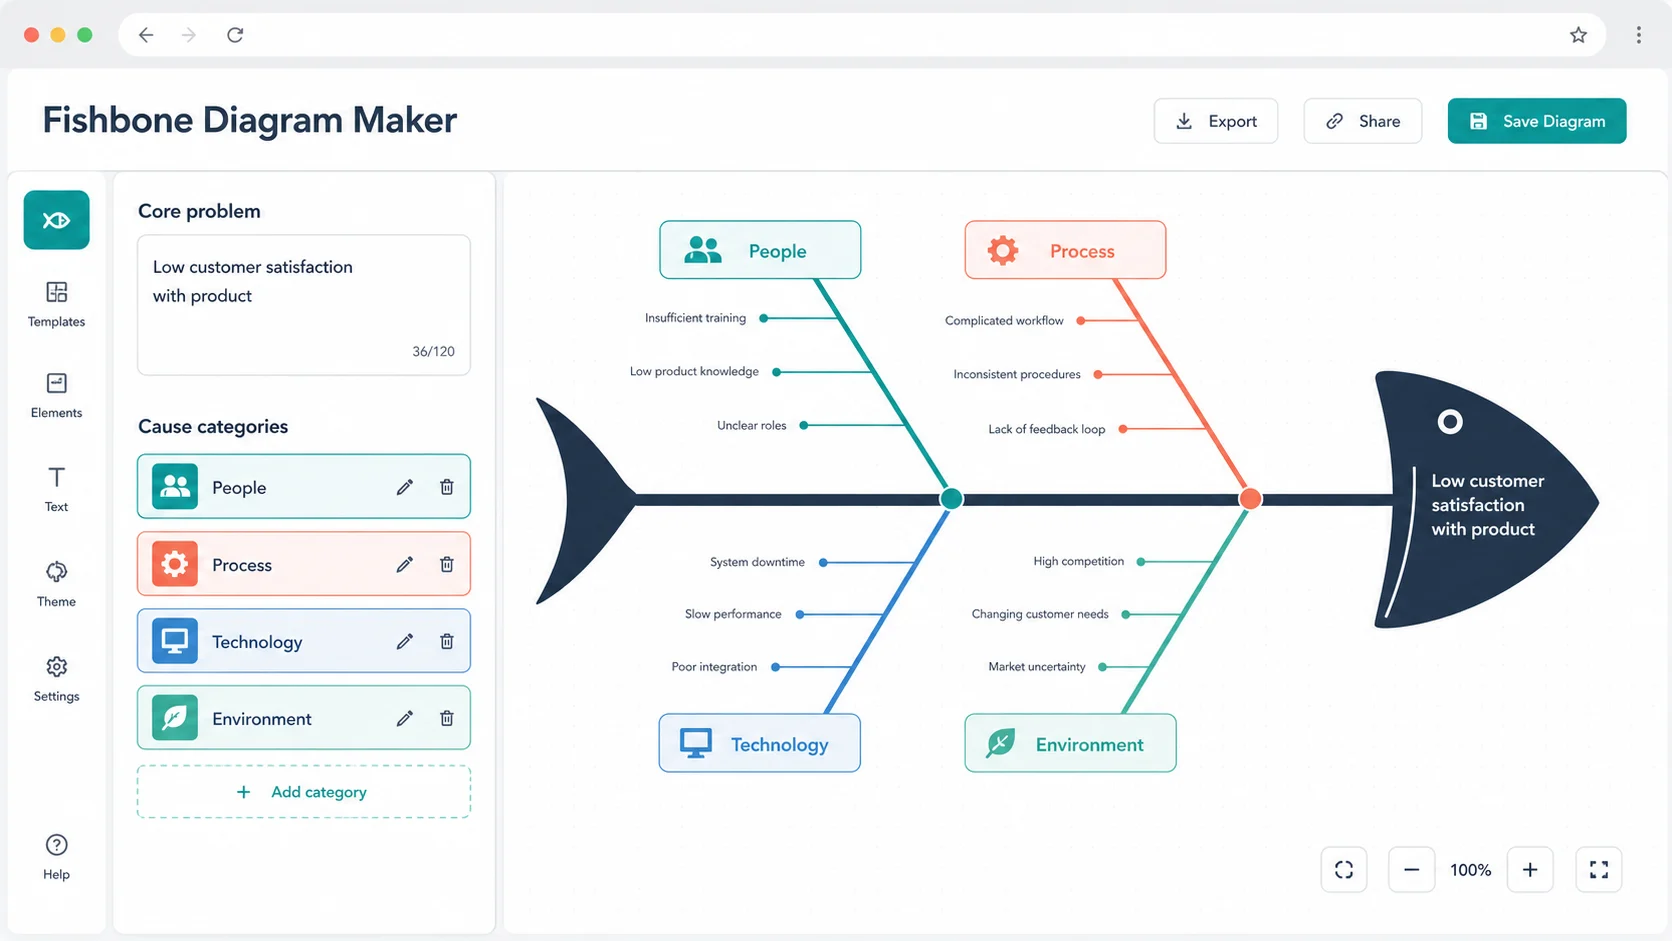
Create main cause categories such as People, Process, Technology, Content, Measurement, or any custom group. Mark important lines with ! so the Fishbone Diagram Maker can show key causes without pretending to prove attribution.
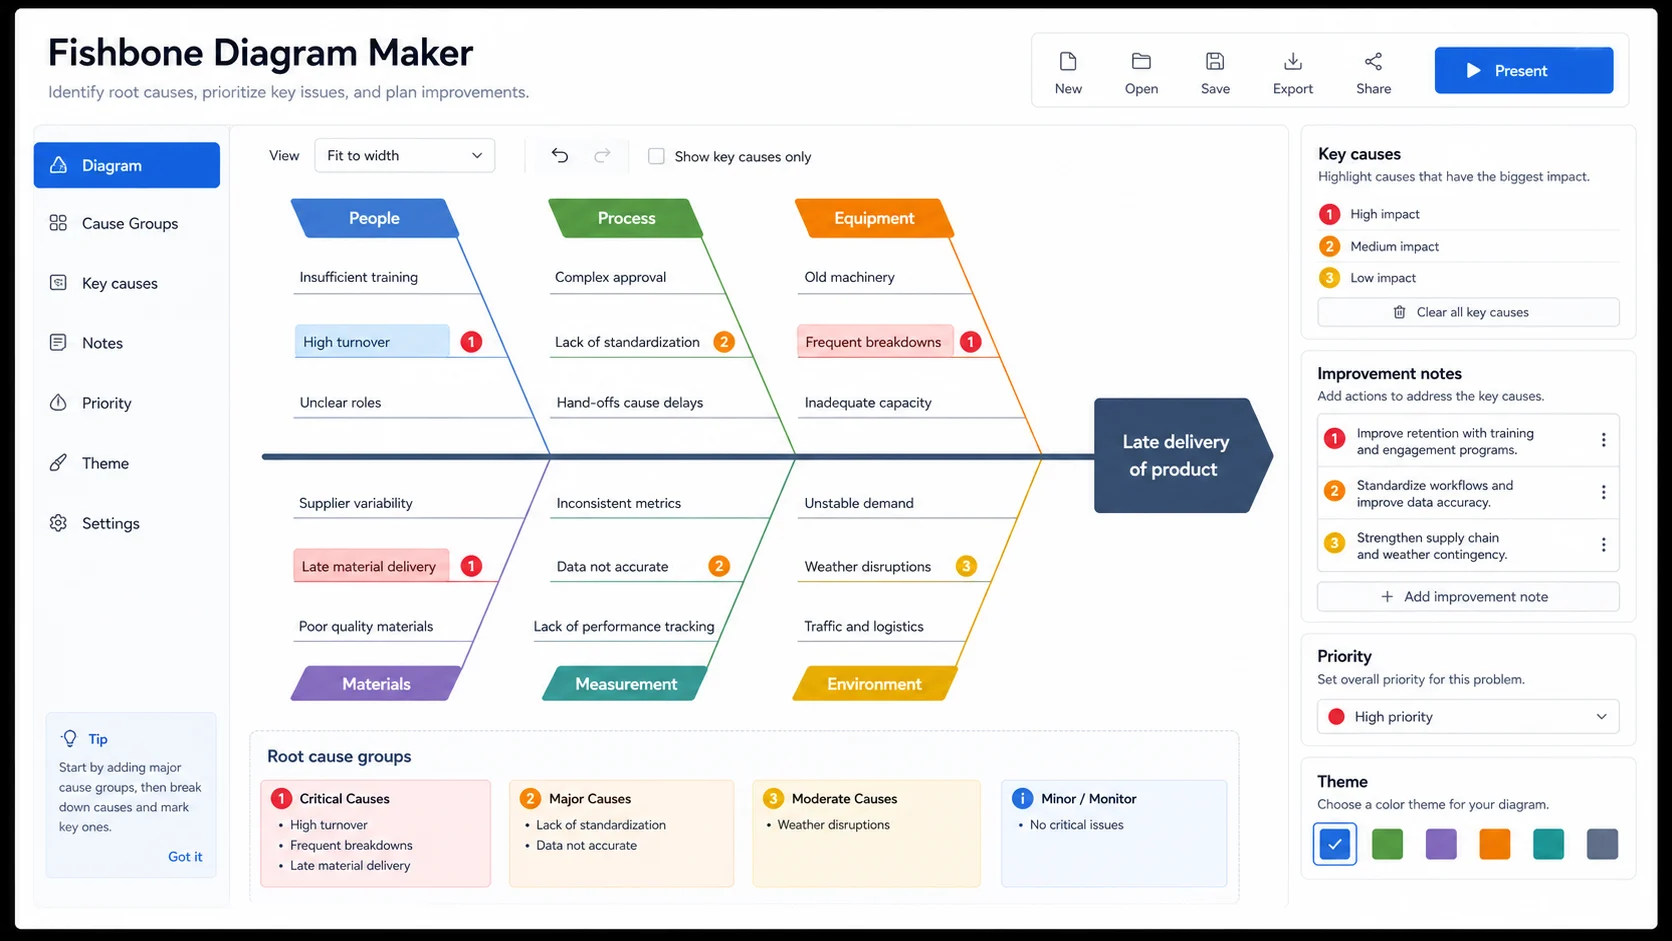
Download the Fishbone Diagram Maker canvas as PNG for slides, SVG for crisp design work, copy Markdown for a review document, or open a print-ready fishbone analysis diagram for workshops.
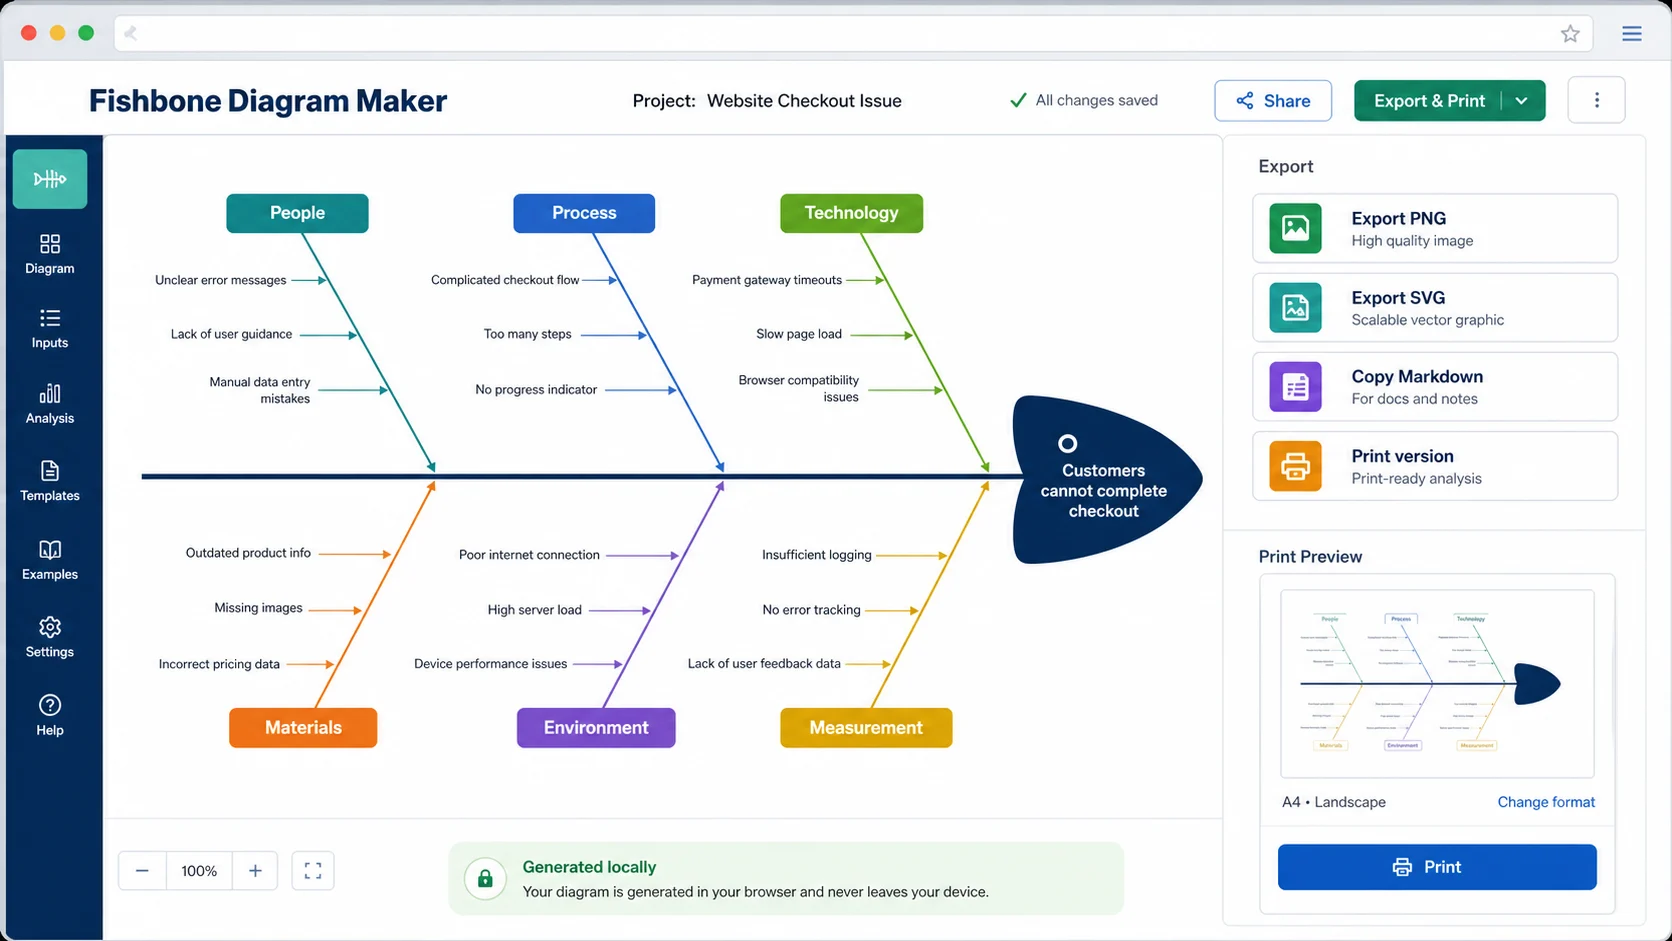
A Fishbone Diagram Maker helps teams structure possible causes before they investigate evidence, assign owners, and decide improvements.
Use the Fishbone Diagram Maker as a Root Cause Analysis Diagram Maker to organize suspected causes before a team validates evidence and chooses actions.
Use the Fishbone Diagram Maker as a Cause and Effect Diagram Maker for defect reviews, process variation, quality checks, and corrective action meetings.
Group suspected bug causes by code, data, release process, environment, users, and measurement without making the Fishbone Diagram Maker invent the final bug cause.
Use the Fishbone Diagram Maker to separate content, technical SEO, campaign, measurement, and market-change hypotheses before checking analytics.
Turn project retrospective notes into an Ishikawa-style diagram with owners, process gaps, dependencies, timelines, risks, and improvement notes.
Map staffing, process, tooling, inventory, vendor, and communication causes in a Problem Cause Diagram Maker layout for operations reviews.
The Fishbone Diagram Maker is a local visual organizer. It helps you structure causes, but it does not search databases, read business systems, or decide the true root cause.
Write a specific core problem such as a defect rate, missed milestone, traffic drop, recurring product bug, or operations delay. A clear problem statement makes the Fishbone Diagram Maker easier to read and easier to validate later.
Start with common groups like People, Process, Technology, Materials, Measurement, Environment, Content, or Promotion, then rename them for your case. Each category becomes a main bone in the Fishbone Diagram Maker result.
Write one possible cause per line. Prefix a line with ! when your team wants to mark it as a priority hypothesis. The Fishbone Diagram Maker highlights the marker, but the evidence still has to come from your own review.
Download PNG for presentations, SVG for design workflows, copy Markdown for problem review notes, or print a workshop-ready fishbone diagram with cause groups and improvement notes.
After exporting, add evidence, owners, dates, and decisions in your project system; the Fishbone Diagram Maker intentionally stays as a local visual organizer.
Common questions about using a browser-local Fishbone Diagram Maker for cause and effect diagrams, Ishikawa diagrams, root cause analysis, and problem cause diagrams.
Yes. This Fishbone Diagram Maker covers the same core visual pattern often called a Cause and Effect Diagram Maker, Ishikawa Diagram Maker, Root Cause Analysis Diagram Maker, or Problem Cause Diagram Maker. The page keeps those search intents together because users usually need one problem cause analysis diagram.
No. The Fishbone Diagram Maker does not perform automatic diagnosis, automatic attribution, business-system analysis, industry database lookup, medical cause judgment, or legal responsibility judgment. You manually enter possible causes and verify them outside the tool.
Use a short core problem, a few main cause categories, and one possible cause per line. Add ! before a line when you want the Fishbone Diagram Maker to mark that cause as important for discussion.
Yes. You can rename categories, add more categories, remove categories, add notes, switch styles, show or hide notes, show or hide key cause markers, and choose a print-friendly version.
Your fishbone diagram is generated locally in your browser. No diagnostic data, business system, or external database is connected, and the Fishbone Diagram Maker does not upload the content you type into the editor.
Yes. You can download PNG, download SVG, copy Markdown, save the draft locally, and open a print-ready fishbone analysis diagram. For formal business reports, add evidence and decisions in your own documentation workflow.
Only as a blank visual organizer for manually prepared notes. The Fishbone Diagram Maker does not judge medical causes, legal responsibility, safety conclusions, or professional liability because those are high-risk decisions requiring qualified experts and reliable data.
The Fishbone Diagram Maker is responsive, but fishbone diagrams have many branches and labels. A tablet, laptop, or desktop gives the best editing experience, while mobile works better for quick review or small diagrams.
Open the Fishbone Diagram Maker, enter your problem, group possible causes, mark key causes, and export a clean cause and effect diagram.
No sign-up, no upload, no external diagnostic database. The Fishbone Diagram Maker runs in your browser.
Your fishbone diagram stays browser-local unless you choose to export it.